Token Metrics You Should Know
Dear Bankless Nation,
Valuing a protocol used to be hard. It still is for some assets.
For a non-cash flow generating assets, like Bitcoin, it’s actually quite hard. Stock to flow, transaction fees, adjusted transaction volumes—there’s really no clear cut way to evaluate it.
Luckily, DeFi protocols are different—they have cash flows. This alone allows us to apply the time-tested metrics of traditional finance to compare and contrast protocols against each other.
Today, Lucas dives into some token metrics you should know.
All of these can serve as valuable gut checks for any prospective investment you’re looking to make. But one thing to remember—markets these days are narrative driven.
Just because a P/S ratio is lower than one, doesn’t mean it’s necessarily a better buy and vice versa. There are plenty of qualitative aspects that you need to consider along with the metrics that we touch on below. Investing is multi-dimensional.
Regardless…we’ve come along way. In the last bull run, valuation metrics like these didn’t exist.
Learn these token metrics, and you’ll be able to front-run the opportunity.
- RSA
TOKEN THURSDAY
Guest Writer: Lucas Campbell, Editor & Analyst for Bankless
Token Valuation Metrics You Should Know
We’ve said it before: DeFi is speed-running thousands of years of traditional finance. We’re relearning, restructuring and reapplying old methodologies to this new paradigm.
And we’ve learned a lot over these few years. We now have a deeper understanding of how protocols operate, how they accrue value, and importantly, we now have the tools to analyze them and uncover new (as well as old) valuation metrics.
As such, we’re going to take some time today to review some general and sector-specific metrics that exist today as well as a few key ratios to consider when you’re researching a new protocol.
Here’s what you should keep in mind:
General Metrics
1. Market Cap vs. Fully Diluted Valuation (FDV)
Understanding the difference between a protocol’s market cap and its fully diluted valuation (FDV)—the total market cap of the protocol if all tokens are in circulation—can be extremely valuable for those looking to take long term positions in an asset.
If there’s a large discrepancy between a protocol’s market cap and its FDV, it means there’s a significant amount of tokens yet to enter circulation. As a result, investors should recognize that there could be a fair amount of inflationary sell pressure overtime as these new tokens come into the market.
This is especially true for newly launched protocols where circulating supplies tend to be a sliver of the total supply. If you remember Curve when it first released CRV, the token was trading at upwards of $15-20 and the FDV for the protocol was over $50B. That was higher than Ethereum at the time!
Recognizing this discrepancy could’ve saved you a fair amount of money as the valuation at time was irrational. As a result, the market corrected itself towards more reasonable valuations. The key takeaway? Knowing the supply schedule of the underlying asset and how it translates to its current valuations can be extremely helpful when taking long term positions (especially for newly launched protocols)!
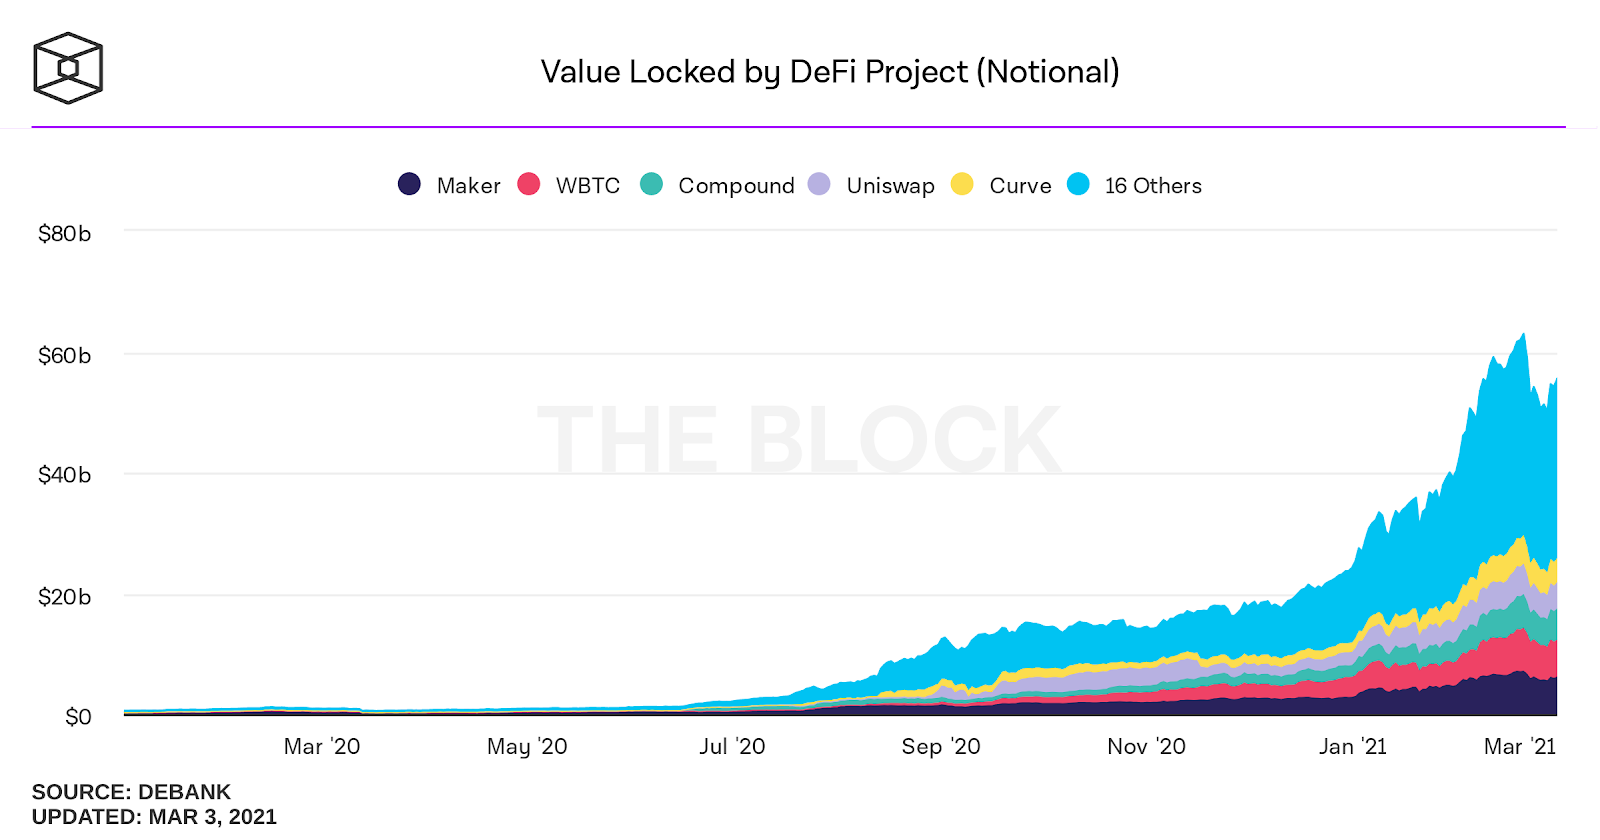
2. Total Value Locked (TVL)
Total value locked is one of the most widely known metrics in DeFi. It represents the total amount of assets held by each protocol—which some could view this as a protocol’s Assets Under Management (AUM). Generally speaking, the more value locked in a protocol, the better.
It means people are actually willing to lock their capital into the protocol, trusting it to a degree, in return for whatever utility it serves (like earning a yield, providing liquidity, or acting as collateral).
That said, it’s important to recognize that with the introduction of yield farming, this metric can become more nuanced with ‘incentivized’ TVL and ‘un-incentivized’ TVL. A protocol with $1B in un-incentivized TVL is likely a stronger indicator of true demand for the service than a protocol with $1B with all of the liquidity juiced up with high yields.
A perfect example is Uniswap vs. Sushiswap.
Both protocols currently boast similar TVLs of $3.7B (Uniswap) and $3.4B (Sushiswap). The key difference is that none of Uniswap’s value locked is incentivized—all of it is organic. On the other hand, a majority of Sushiswap’s liquidity is incentivized with substantial SUSHI rewards.
It doesn’t mean one’s necessarily better than the other, but it’s worth highlighting. As such, when you’re looking into TVL as a valuation metric, make sure to recognize how much of it is incentivized versus not.
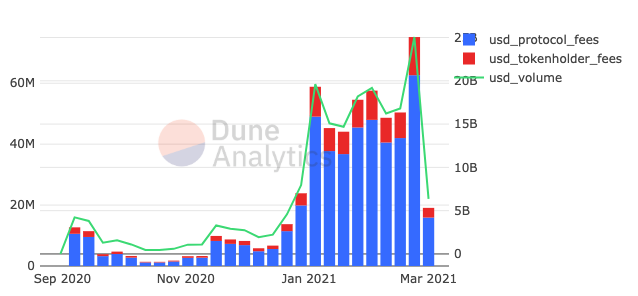
3. Revenue
A protocol’s revenue equals the total fees paid to the protocol’s supply-side actors. For AMMs, this could be total fees paid to liquidity providers; for interest rate protocols, this could be the amount of interest paid by borrowers. It really just boils down to the amount that users are willing to pay to use the protocol. And that’s why revenue is such a crucial metric—it literally translates to the amount people are willing to pay the protocol in return for its service (like easy, quick 24/7 swaps between any erc20 token).
4. Protocol Earnings
While revenue is the amount that users are willing to pay to the protocol, which largely accrues to the supply-side actors providing the underlying service, protocol earnings is the amount of revenue that actually accrues to the token. This is effectively the bottomline for a protocol—the profit margin.
That said, just like how early stage startups and growth companies don’t pay out dividends to stockholders, not every protocol allocates cash flows to the token (as it may not be an efficient use of capital at the time).
Uniswap and Sushiswap are great examples that we like to pick on. Despite being the clear leader in DeFi in terms of revenue generated, none of Uniswap’s cash flows accrue to the UNI token holders yet. Comparatively, Sushiswap elects to direct ~16% (0.05% of the 0.30% swap fee) of the revenue generated from swaps to xSUSHI stakers.
5. Price to Sales
The Price to Sales ratio (P/S) compares a protocol’s market cap to its revenue. For avid Bankless readers, many of you are probably familiar with this metric. It serves as a solid gauge as it compares the market cap to revenue (i.e. usage). In traditional finance, the P/S ratio serves as a basic metric for measuring how the market values the asset relative to amount of revenue it generates and its expectation of future growth.
At its core, the P/S ratio translates to the market is willing to pay $X for every $1 generated in revenue. What’s interesting is that the P/S ratio can mean different things in the context of different protocols. Here are some examples:
- DEXs: The market is willing to pay $X for every $1 earned in trading fees
- Lending: The market is willing to pay $X for every $1 generated in interest paid by borrowers
- Yield: The market is willing to pay $X for every $1 generated in yield for LPs
Therefore, the P/S is not the best indicator for cross-sector comparisons as it can be nuanced, however, it serves as a valuable ratio when comparing like-protocols!
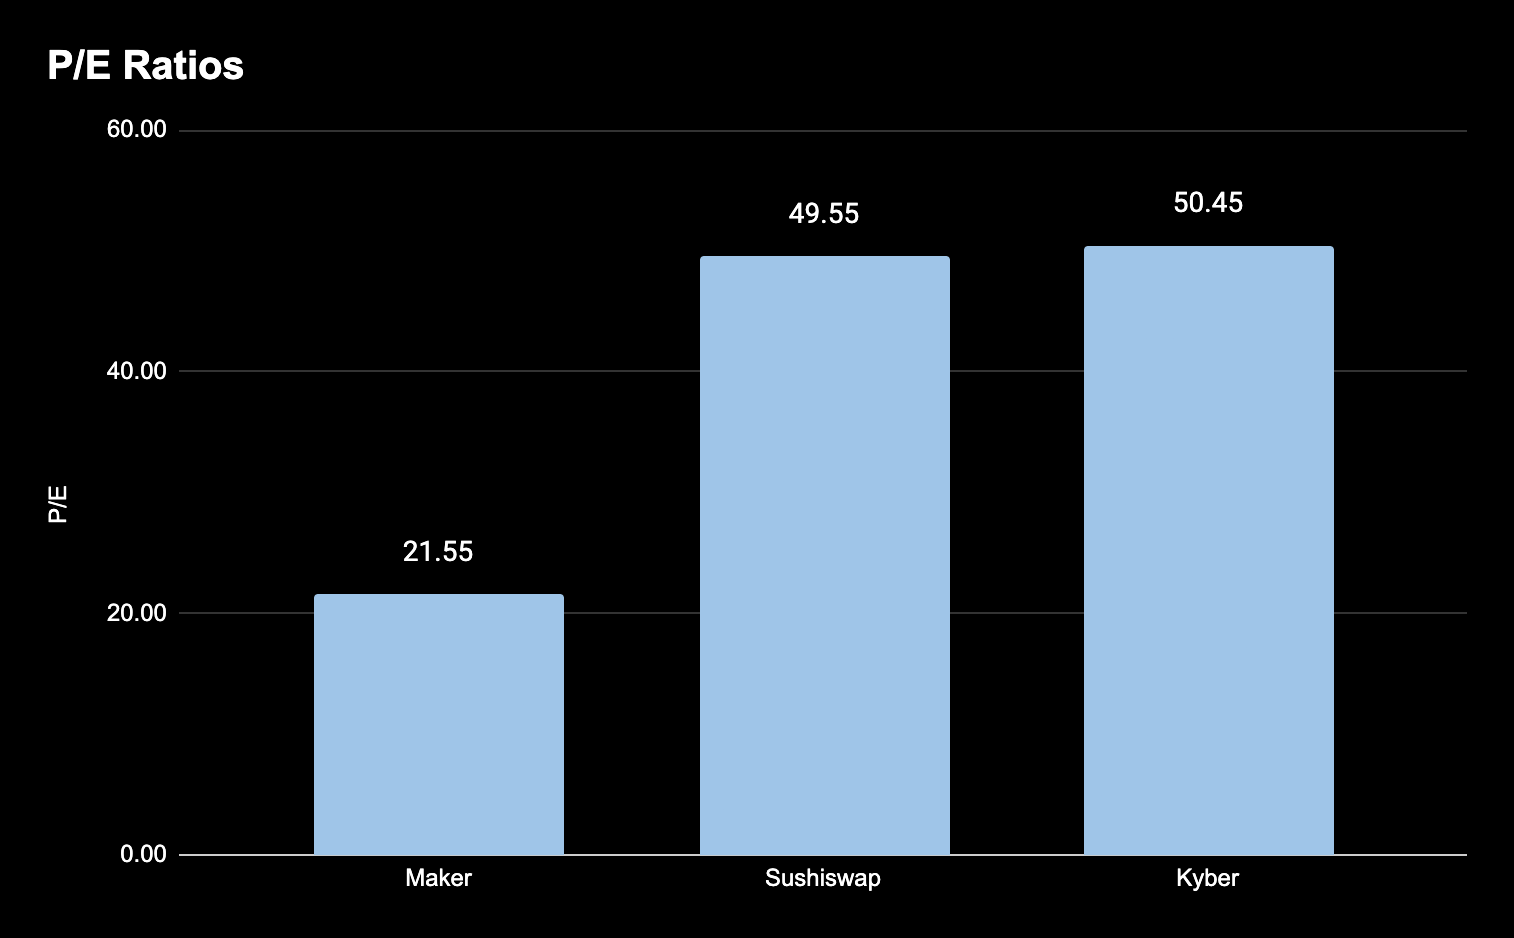
6. Price to Earnings
With many DeFi protocols in their early growth stages, it’s common to not have direct cash flows for tokenholders—a parallel drawn with the traditional world. With that in mind, as the industry matures and more protocols distribute dividends to token holders for various activities, the price to earnings ratio will become ever-more relevant.
That said, there are a few protocols around today—like Maker, Sushiswap, Kyber and others—that offer direct cash flows to tokenholders. Here’s some napkin math on current P/E ratios for applicable protocols based on the revenue data from Token Terminal and the underlying profit schemas for each protocol.
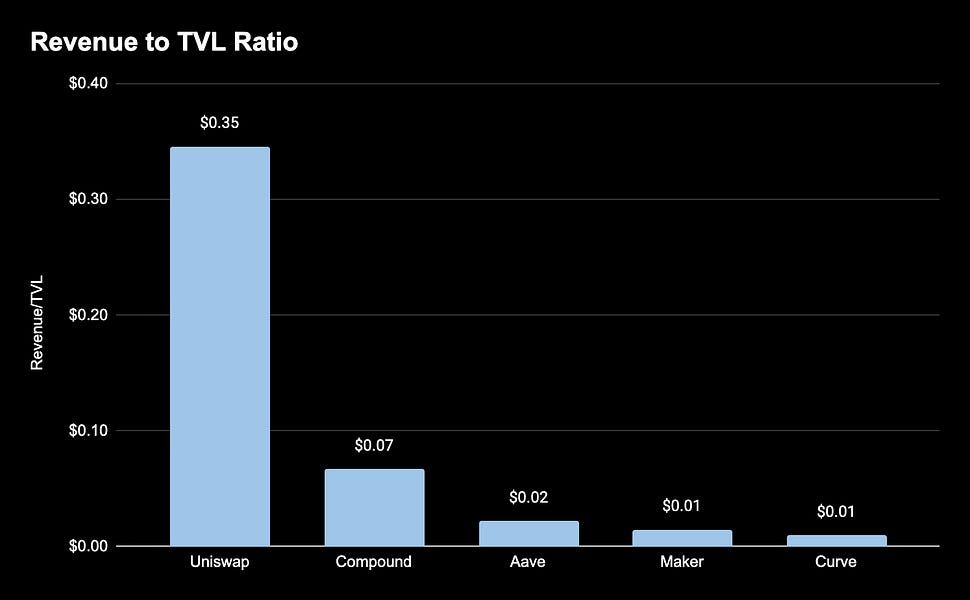
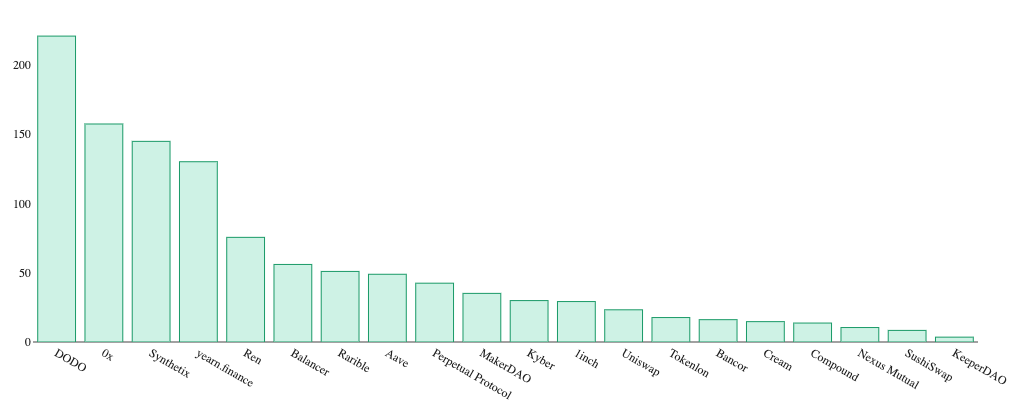
7. Revenue to Value Locked
The Fees-to-Value Locked ratio can serve as an interesting metric to understand how efficient a protocol is at generating fees from the capital it holds. For reference, we calculate this metric by dividing annualized fees by the value locked.
Similar to above ratios, this literally translates to ‘the protocol is able to generate $X for every $1 locked in it’.
The closer “x” is to 1, the more effective the protocol is at earning fees from the underlying capital, and could indicate a better investment than a similar protocol. As an example, here are the top 5 protocols by value locked and their respective ratios by combining data from Token Terminal and DeFi Pulse.
Uniswap leads the charge as the protocol is able to generate $0.35 in revenue for every dollar in value locked—pretty efficient if you ask me!

Sector Specific Valuation Metrics
Sector specific metrics act as fundamental measurements of whether or not a protocol is being used for its intended purpose.
How much volume is being traded on the DEX? How much is being borrowed from the lending protocol? Is anyone minting synthetic assets?
These are key questions that you should ask when researching the viability and usage of each protocol. Here are a few that you should keep in mind:
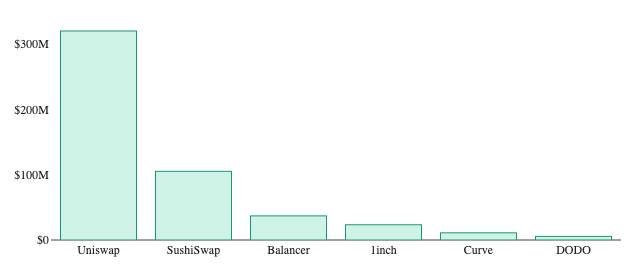
DEXs
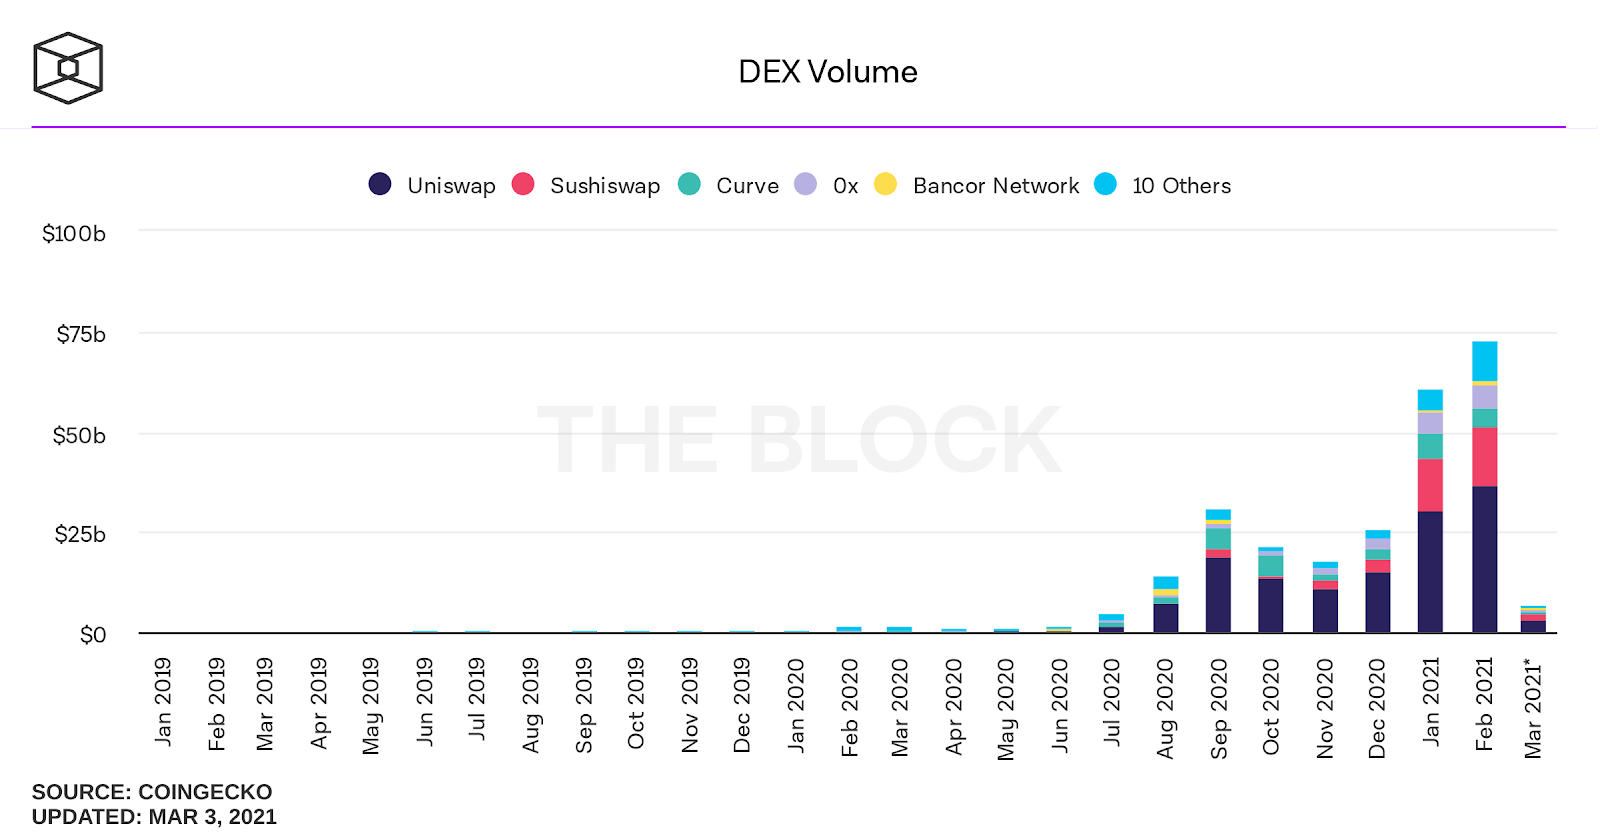
1. Trading Volume
Naturally, one of the most basic metrics when gauging the success of a liquidity protocol is the total volume it facilitates. Higher volumes translates to more cash flows for protocol participants, including Liquidity Providers and token holders (if applicable).
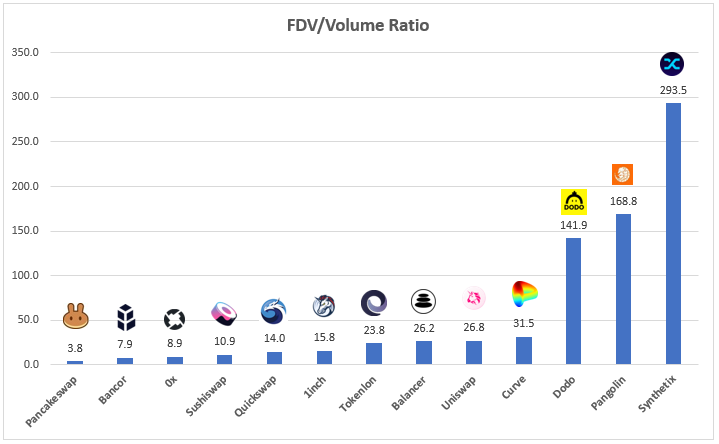
2. Price to Volume (P/V)
The Price to Volume Ratio (P/V) is a DEX-specific valuation metric that holds similar properties as the P/S ratio. We touched on this in DEX Title Fight: Uniswap vs. Sushisap. The P/V ratio is calculated by taking the protocol’s fully diluted valuation and dividing it by the exchange’s daily volume.
The rational behind this ratio is rather than valuing these liquidity protocols based on the amount of fees they generate, which can become nuanced when looking at protocols with different take rates, the P/V ratio cuts through it all and identifies how the market is valuing the protocol based on the amount of volume the exchange facilitates.
Lending
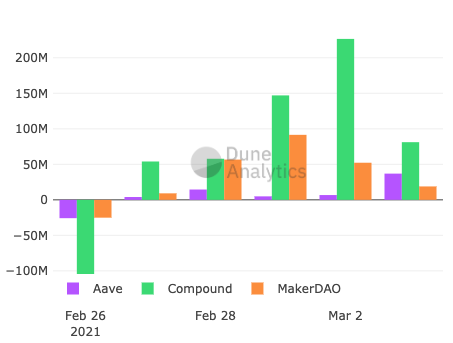
3. Daily Net Borrow
For interest rate protocols like Compound, Aave, Cream, and others, the total outstanding debt and utility rates indicate the demand to borrow from the protocol.
This is key for one reason with interest rate protocols: it kickstarts a flywheel. The higher the demand to borrow, the better rates are for depositors, which drives a higher incentive to add more liquidity from depositors, which increases the protocol’s capacity for borrowing demand.
Simply put, more borrowing demand means higher rates for suppliers which is a crucial piece to attracting capital to the protocol.
Derivatives
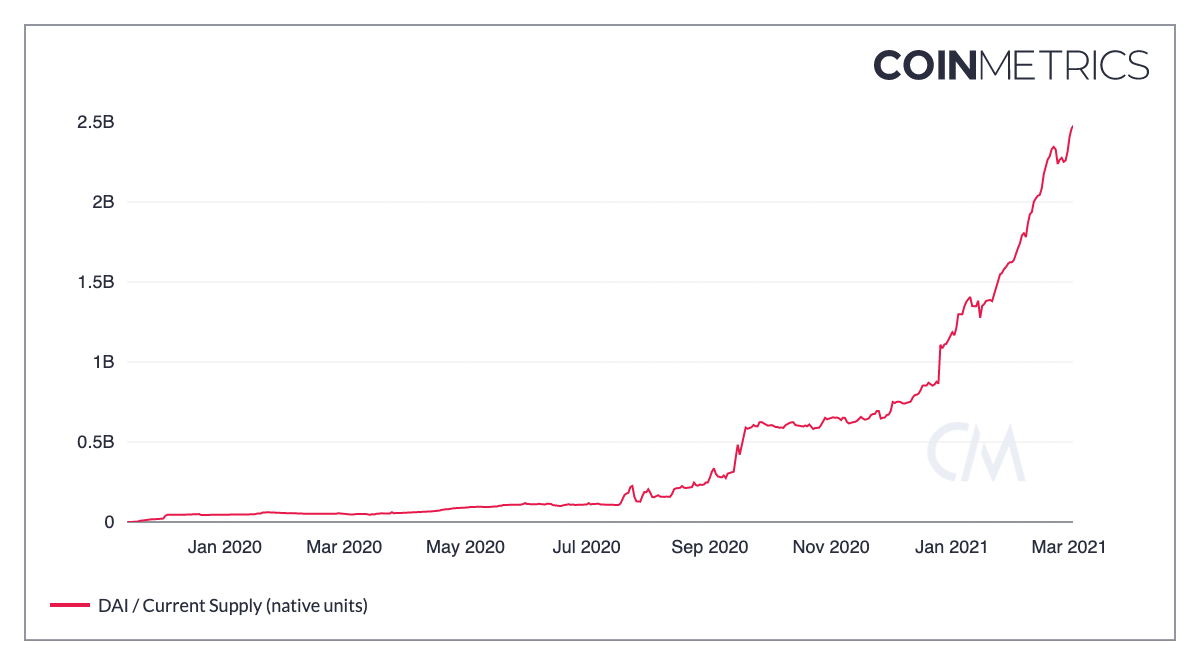
4. Total Outstanding Debt/Derivatives
Outstanding debt or synthetic assets for derivative protocols like Synthetix and Maker is one of the key drivers behind revenue and protocol earnings.
The more debt outstanding, the more capital available for the protocol to monetize, and the more cash flows that can be distributed to token holders. To boil it down, debt outstanding is really just a key indicator of demand for the protocol’s synthetic assets (i.e. Dai for Maker, Synths for Synthetix, etc.).
Insurance
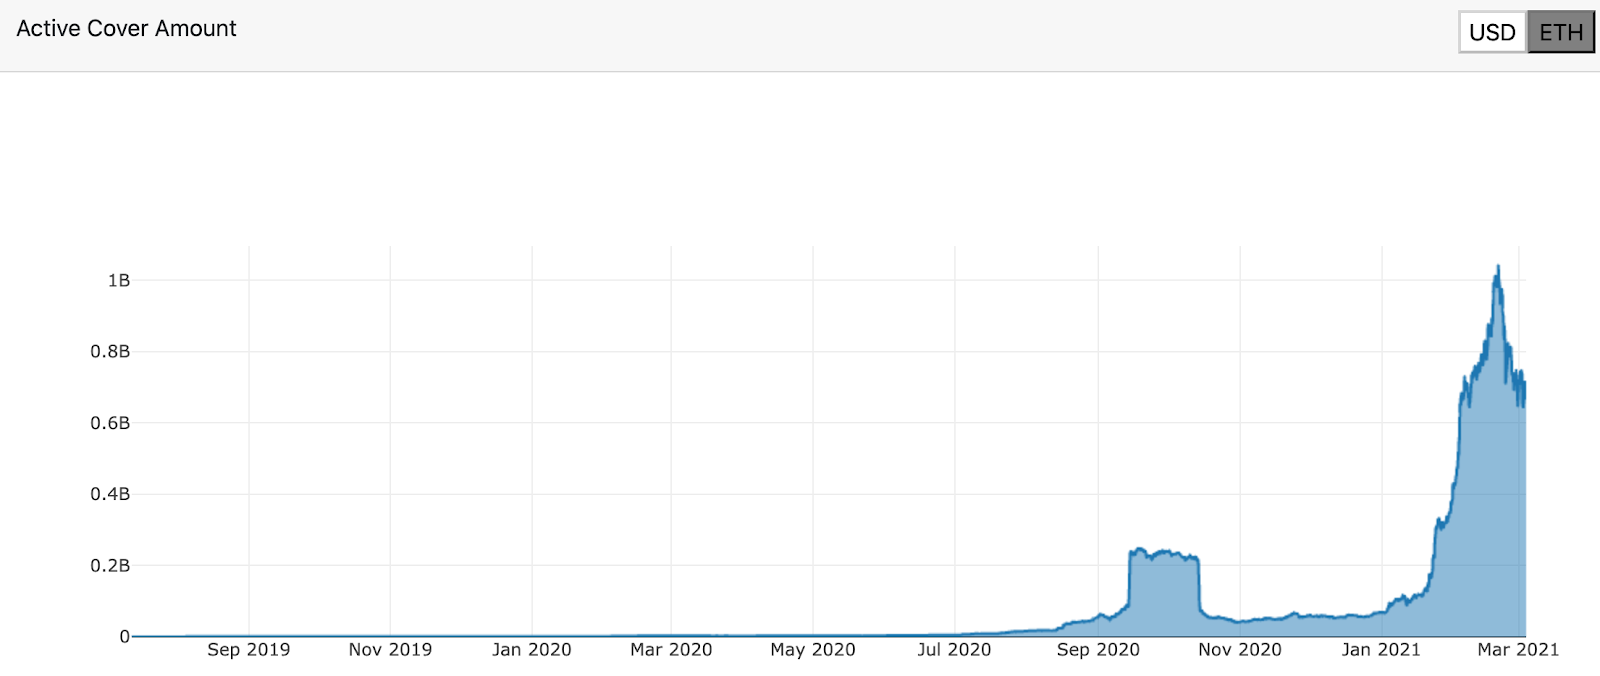
5. Active Cover
Active covers for insurance protocols like Nexus Mutual and Cover serve as the most fundamental indicator for this sector.
Simply put, it shows the demand for the protocol’s ‘insurance policies’ from the market. The higher the active cover amount is, the more insurance policies being sold, which means the protocol is collecting more premiums (which is revenue). With that said, this relationship is very direct with Nexus Mutual as the token, NXM, is priced on a bonding curve driven by the total capital in pool. The more active covers, the more premiums earned by the capital pool, which causes upwards pressure on Nexus Mutual’s bonding curve!
Conclusion
There’s plenty of ways to dissect each and every protocol these days. Fortunately, the industry has evolved into a diverse ecosystem of protocols that allow you to compare and contrast each other to see how they stack up.
With that said, there’s plenty of qualitative aspects that aren’t shown in the numbers that are equally, if not more, important to consider. This may include the caliber of the team, new products in the pipeline, and most importantly, the narrative.
Like in traditional finance, fundamental valuation metrics have largely gone out the window.
Value investing is obsolete. The entire market is narrative-driven now. Markets aren’t pricing assets based on revenue multiples or price to earnings ratios anymore—they value it based on the narrative of the company (some may call them memes).
This definitely applies to crypto as well. If NFTs are hot right now, then NFT token projects are going to moon. It’s a simple as that—no analysis needed.
However, fundamental valuation metrics do serve as a nice gut check, especially when you’re digging into like-protocols. If a project instantly hits the market with a $50B fully diluted valuation, displacing the network it’s built on in terms of market cap, then it’s probably not a great time to invest. The market is likely overextended.
So at the end of the day, it’s important to recognize that the crypto market is young, inefficient, and prone to crazy, irrational movements that don’t necessarily line up with the fundamentals.
Regardless, fundamental valuation metrics like the ones outlined above serve as solid indicators to give you hard numbers to back your investment thesis.
Action steps
Evaluate your favorite protocols with the above metrics
Read up on previous Bankless pieces that apply these metrics in more detail: