How to analyze crypto assets
Donate to the Bankless Gitcoin Grants! Even 1 Dai goes a long way. Let’s onboard the world.
Dear Bankless Nation,
Our analysis tools are leveling up.
A year ago the industry barely understood how to value crypto capital assets. We were scratching the surface on concepts like price-to-earnings (P/E) and price-to-sales (P/S).
We didn’t have Token Terminal. ❤️
But now we do. And now we can dive deeper than ever before into the value flows of DeFi protocols and crypto capital assets.
- Which protocol are users willing to pay the most for?
- Where does the majority of Maker’s revenue come from?
- How has Aave performed relative to the rest of the market?
- Which protocol is the cheapest valued in terms of revenue generation?
We have these answers now. So when mainstream finance takes notice during this crypto bull cycle they’ll see some familiar valuation models.
But as usual, you’re already here front-running their opportunity.
Let’s learn how to analyze crypto assets using Token Terminal.
- RSA
🙏Sponsor: Aave—earn high yields on deposits & borrow at the best possible rate!
We just released episode 27 of State of the Nation!
📺 Watch State of the Nation #27: Is ETH Money? w/ Ryan Selkis
Recapping 2021 Crypto Theses and the Ryan vs. Ryan debate on whether ETH is money.
We’re now live streaming State of the Nation—join us at 2pm EST every Tuesday!
TACTICS TUESDAY
Tactic #70: How to analyze crypto assets
Guest Writer: Henri Hyvärinen, Aleksis Tapper & Robert Valta, co-founders of Token Terminal
Token Terminal is a data analytics platform that provides traditional financial metrics on crypto assets.
They recently released a major upgrade, giving analysts new tools for understanding the state of crypto markets and how they stand relative to their peers. This tactic will dive into some of the metrics available on Token Terminal and how you can use them to your advantage when exploring this new asset class.
- Goal: Learn how to interpret on-chain business data using Token Terminal
- Skill: Intermediate
- Effort: 1 hour
- ROI: Make better token bets based on fundamental metrics
What is Token Terminal?
Token Terminal is a data analytics platform that provides traditional financial metrics on crypto assets.
We believe that both blockchains and blockchain-based applications are conceptually similar to traditional marketplace companies. They’re Internet-native marketplaces whose—often fully digital—services generate revenue that’s split between the projects’ users (supply-side participants) and owners (tokenholders).
In some instances, the revenues can be directed to only one side, as is currently the case for projects like Uniswap and Ethereum, where the supply-side participants (liquidity providers and miners, respectively) earn all of the revenue generated.
It is worth noting that a majority of current crypto projects are venture-backed and still record their costs and expenses off-chain (exceptions like Yearn do exist though), which is why we’ve initially decided to focus primarily on revenues instead of earnings.
Once more projects start recording their costs and expenses on-chain, we’ll be able to provide accurate price to earnings ratios (P/E) as well.
Metrics initially available in the Terminal
Below is a walkthrough of all the different metrics currently available in the Terminal:
I. Market cap — what is a project valued at? Calculated based on a project’s fully-diluted token supply.

II. Price to sales ratio (P/S) — how is a project valued in relation to its revenues? Calculated as a project’s market cap divided by its annualized revenue. Annualized revenue is a forward-looking revenue estimate that is calculated based on a simple 30-day moving average.

III. Token trading volume to market cap ratio (VOL/MC) — how efficient is the price discovery for a project’s native token? Calculated as the daily trading volume for the project’s native token divided by its market cap.

IV. Total value locked (TVL) — how much money has been deposited into a project’s smart contracts? Calculated as the liquidity deposited to a project’s smart contracts (exchange) or as the difference between the assets deposited and borrowed (lending).

V. Gross merchandise volume (GMV) — what is the demand for a project’s service? Calculated as the project’s trading (exchange) or borrowing (lending) volume.

VI. Revenue—how much are users paying to use a project’s service? Calculated as GMV * Take rate. For now, revenue refers to the total fees paid by the project’s users. Where available, we’ve also included data on how the total revenues are split between the users (supply-side participants) and the owners (tokenholders) of a protocol.

VII. Take rate—what does it cost to use a project’s service? Refers to the fee charged on the GMV, either in the form of a trading fee (exchange) or an interest rate (lending).

How to get the most out of the charts
When going through an individual project’s dashboard, it’s often useful to write down the:
- The launch date for the project’s native token,
- Dates for potential token incentive distributions, and
- Dates for when new assets (trading pools or lending markets) have been included in the project’s platform.
These events are usually clearly visible in the GMV and revenue composition charts. For example, the launch of token incentives can temporarily increase the demand for the project’s service (increase its GMV).
Counter charts
The counter charts focus on current values, benchmarked against the project’s peer group (currently other DeFi projects listed on Token Terminal). In addition, they include month over month changes and compounded monthly growth rates (CMGR) for longer time periods. When looking at the counter charts, it is useful to think about what could explain the upward or downward movement month over month? Is the movement inline or in contrast with the project’s peer group, why?

Historical charts
The historical charts provide deeper insight into a project’s development over time.
In historical charts, it’s useful to look for patterns (stable, volatile, one-off spikes or drops, correlation with the peer group, etc.) and the underlying events that could explain them, such as token incentive launches. The toggle feature enables the user to focus the view on either the project or the peer group (DeFi average).

Composition and normalized charts
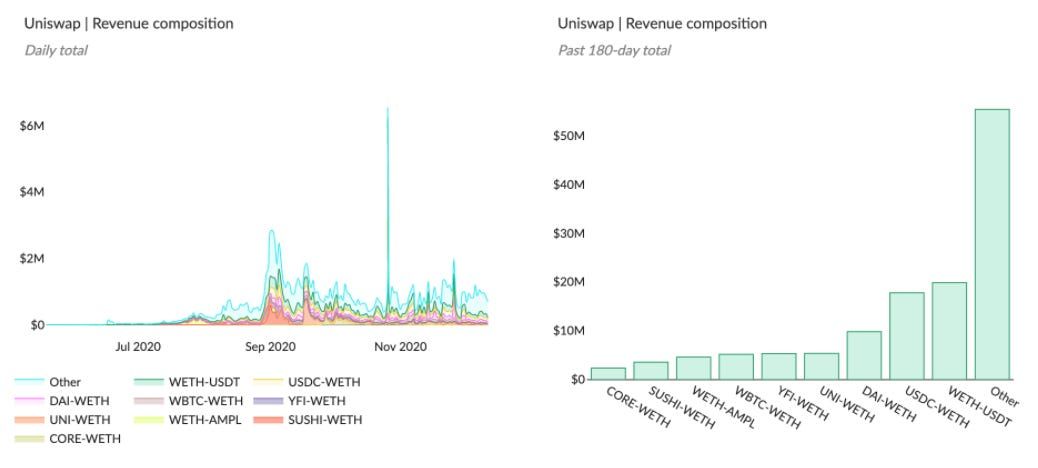
The composition charts reveal the underlying dynamics of a project’s business.
For GMV, which trading pools or lending markets are most used? For take rates, which trading pools or lending markets charge the highest or lowest fees? For revenue, which trading pools or lending markets generate the most fees?
Normalized versions of composition charts show how the relationships between the different trading pools or lending markets have evolved over time. The toggle feature enables the user to focus the view on specific trading pools or lending markets.

Charts with multiple trading pools or lending markets
For projects that have multiple different GMV and revenue components, we’ve chosen to visualize the nine components with the most GMV and revenue during the relevant time period (i.e. 30-days, 180-days or since launch) in addition to an “Other” category. A large “Other” category would indicate that the long-tail of trading pools or lending markets generate significant GMV or revenue and vice versa.
The toggle feature enables the user to focus the view on specific trading pools or lending markets.

Closing Thoughts
While DeFi is new, we’re starting to grow our understanding of this nascent asset class.
Look at DeFi protocols through the lens of digitally-native marketplaces. They’re fully permissionless where the services they offer are accessible by anyone, anywhere and on both sides of the market (supply side & demand side).
And we’ve only unlocked the first stage. As projects continue to mature, and report their costs and expenses on-chain (check out Yearn’s quarterly financial report), we can evolve the metrics and methods we use to compare these protocols, giving us a better understanding of the assets that underpin these systems.
A year ago, we didn’t have these tools. Now, we do.
And it’s only going to get better from here.
Action steps:
Research a DeFi protocol on Token Terminal using this tactic as a guide
Read previous pieces on valuing crypto capital assets:
Author Bio
Henri Hyvärinen, Aleksis Tapper & Robert Valta are the co-founders of Token Terminal, a data analytics platform that provides access to standardized metrics for easily quantifying and comparing the performance of different crypto protocols.
Go Bankless. $12 / mo. Includes archive access, Inner Circle & Deals—(pay w/ crypto)
🙏Thanks to our sponsor
Aave
Aave is an open source and non-custodial protocol for money market creation. Originally launched with the Aave Market, it now supports Uniswap and TokenSet markets and enables users and developers to earn interest and leverage their assets. Aave also pioneered Flash Loans, an innovative DeFi building block for developers to build self-liquidations, collateral swaps, and more. Check it out here.
Not financial or tax advice. This newsletter is strictly educational and is not investment advice or a solicitation to buy or sell any assets or to make any financial decisions. This newsletter is not tax advice. Talk to your accountant. Do your own research.
Disclosure. From time-to-time I may add links in this newsletter to products I use. I may receive commission if you make a purchase through one of these links. I’ll always disclose when this is the case.