Are DeFi Tokens Worth Buying?
Level up your open finance game three times a week. Subscribe to the Bankless program below.
Dear Crypto Natives,
“Should I buy SNX or MKR? Is LINK a good investment? How bout ZRX?”
I get asked this daily.
My answer is always the same:
At Bankless we don’t tell you what to buy. We teach you how to think.
And if you’re thinking like a fundamentals investor (not a trader or narrative investor) today’s article may be the best way to evaluate DeFi token investments.
Read it and level up.
- RSA
WRITERS CORNER
Are DeFi Tokens Worth Buying?
Post by: Lucas Campbell of Fitzner Blockchain Consulting & DeFi Rate
A Recap on Crypto PE
In traditional finance, the price-to-earnings ratio (PE) is a simple formula for understanding how investors value a company’s future growth expectations relative to its earnings.
By definition, a PE ratio means that the market is willing to pay $x dollars for every $1 generated by the company. A company like Netflix, a high-tech growth stock, has a PE ratio of 84.2, meaning the market is willing to pay $84 for every $1 earned by Netflix.
PE Ratios are an effective tool for valuing capital assets at large. Capital assets, like stocks, bonds and income-producing real estate, all provide investors with cash flows on future earnings.
With the proliferation of DeFi in 2019, we’ve seen the emergence of new money protocols on Ethereum. Many of these money protocols generate cash flows by charging a small fee for usage. These cash flows are used to either (1) directly distribute it to participants in the ecosystem or (2) used to burn the native token to drive scarcity.
While burning native tokens may not seem like the most intuitive mechanism that directly benefits tokenholders, token burns are effectively dividends as they increase the tokenholder’s percentage share of the network or protocol.
With many of these permissionless money protocols accumulating cash flows, PE ratios can be a useful tool for valuing the underlying native tokens as they hold similar properties to traditional capital assets.
While this is not a perfect measurement or evaluation method given the nascency of the crypto assets, it does provide a simple framework for looking at how these tokens stand with respect to their peers.
In the lens of crypto assets, the equation for Price-to-Earnings ratio can be seen as:
Liquid Market Cap / Annualized Earnings
Earnings for DeFi Tokens
Fortunately for us, our friends over at Token Terminal have already done a majority of the leg work for aggregating cash flow data for many of the prominent money protocols in existence today. (RSA—I wrote about this here!)
Here’s some background on our selection of money protocols and how they accrue fees via usage.
- Synthetix - A synthetic asset issuance protocol where SNX holders can stake tokens and earn fees generated via the exchange of Synths.
- MakerDAO - In multi-collateral Dai, the spread between the Dai Savings Rate and the Stability Fee is used to burn MKR.
- Kyber Network - KNC tokens are used to pay token exchange fees where a portion of the KNC is burned and permanently removed from the circulating supply, the remainder is distributed to reserve managers who stake KNC.
- 0x - ETH-denominated fees are generated from token exchanges and distributed pro-rata to liquidity providers who stake ZRX.
- Nexus Mutual - ETH and DAI from expired insurance covers are added to the capital pool, increasing the value of the NXM token.
- Augur - REP tokenholders earn fees in ETH (soon Dai) when they report honestly on the outcomes of any of the prediction markets.
- Aave - fees are earned on loan origination which is split between lenders and the protocol. Protocol fees are used to burn LEND tokens
- Uniswap - all trading on Uniswap generates a fee distributed to the liquidity providers within each respective liquidity pool.

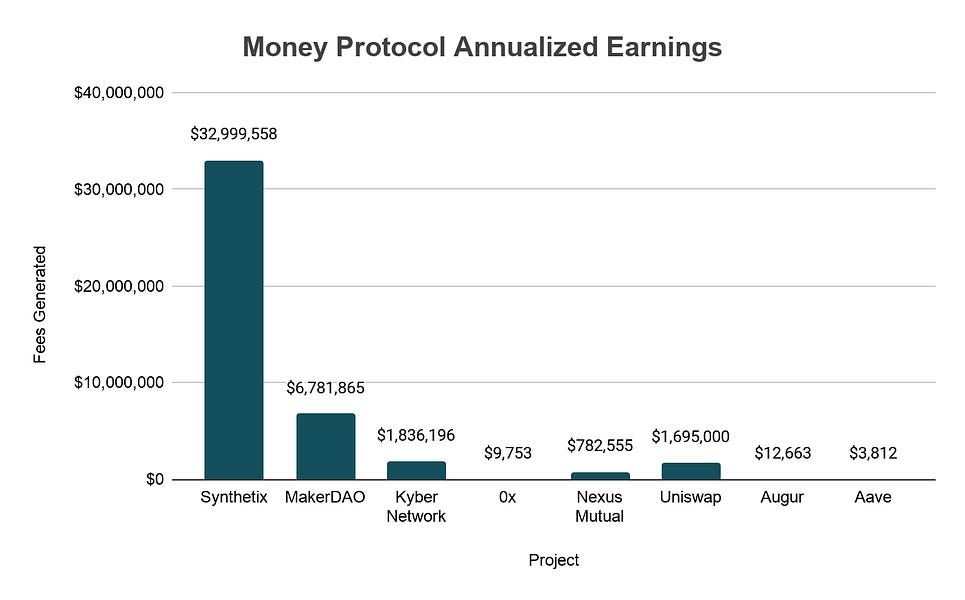
(Above) Annualized cash flows for money protocols (data via Token Terminal)
Snythetix
Looking at the annualized cash flows from major money protocols, we can see that Synthetix is the clear leader, generating nearly $32M in annualized fees via Synthetix.Exchange. For those unfamiliar, Synthetix charges a fixed 0.30% on all Synth trades where the fees generated are distributed pro-rata to SNX stakers for providing collateral to the underlying Synths.
Maker
Despite being the largest in market cap and the foundation for other money protocols, MakerDAO has only accrued $6.7M in annualized earnings via stability fees. The recent transition from Single Collateral Dai to Multi-Collateral Dai also changed the dynamic for MKR burns as it introduced the Dai Savings Rate (DSR).
The DSR uses the stability fees accrued from the system’s outstanding debt to distribute it to Dai holders who lock their Dai into the smart contract. With that, there’s a spread between the DSR and the Stability Fee, currently sitting at 0.25% (7.5% DSR and 8% SF). The cash flows earned from the spread is used to purchase and burn MKR, providing a widespread dividend to MKR holders for governing the overarching system.
Kyber & Uniswap
DeFi’s two biggest permissionless liquidity protocols, Kyber and Uniswap, are the only others to generate seven figures in annualized earnings. For Kyber, a portion of the fees are used to burn Kyber’s native token (KNC) with the remainder distributed to reserve managers. It is important to note that Kyber’s upcoming Katalyst upgrade will change the dynamic on how fees are accrued, distributed, and burned throughout the system. The other prominent permissionless liquidity protocol, Uniswap, is an untokenized ecosystem where the fees are distributed to liquidity providers for staking ETH and the other token pair in the pool - we’ll dive more into this later.
Nexus
The last money protocol to earn a remotely substantial amount of cash flows is Nexus Mutual—a decentralized insurance protocol. Nexus Mutual operates on a bonding curve where users can purchase insurance covers on prominent value-storing smart contracts. The covers insure a smart contract in the instance of a hack or bug over a certain amount of time which is set by the user upon purchase. If the cover expires without any claims, the ETH and DAI used to purchase to cover is added to the capital pool, increasing the value of the NXM token.
0x, Augur, & Aave
The last few major money protocols—0x, Augur, and Aave—have all earned a negligible amount in fees, especially when looking at their liquid market caps. Aave is fairly new so we can discount their accrued fees. However, 0x and Augur have both been live on Ethereum main net for a fair amount of time. With that said, 0x recently shifted their token economic model to allow liquidity providers to stake ZRX and earn ETH-denominated fees. Augur on the other hand is waiting on its upcoming v2 upgrade where the capital pool for prediction markets will be denominated in Dai rather than a volatile asset like ETH. This change in addition to a few other improvements should increase the accessibility for the decentralized prediction market platform.
PE Ratios
With all the above in mind on how these protocols generate cash flows, here are the PE ratios for prominent DeFi tokens. (Remember, higher can indicate overvaluation!)

(Above) P/E Ratios for Prominent Money Protocols
As we can see, Synthetix and Nexus Mutual both have fairly low PE ratios both in terms of crypto assets as well as traditional capital assets with their ratios of 5.7 and 13.2, respectively. Considering these tokens fuel emerging open, permissionless financial products (synthetic assets and insurance), it may be possible that the future growth for these money protocols are being undervalued by the broader market.
Next is Kyber Network, boasting a fair PE ratio of 31.2 which puts it in the same ballpark with Microsoft who holds a PE ratio of 30.27. Kyber Network established itself as one of the leading permissionless liquidity protocols within the DeFi space in 2019, however, price action to reflect this growth has largely gone unrealized. In the coming months, it will be interesting to see how its PE ratio changes with its upcoming Katalyst upgrade (a token economic rework) given its one of the leading DEXs in terms of exchange volume.
MakerDAO, which holds a PE ratio of ~80, is relatively in-line with many high-growth stocks today. With over 12,000 MKR burned and well-over 100M Dai in circulation, MakerDAO has seen a tremendous amount of growth over the past few years as it continues to act as one of the core tenants for the proliferation of DeFi.
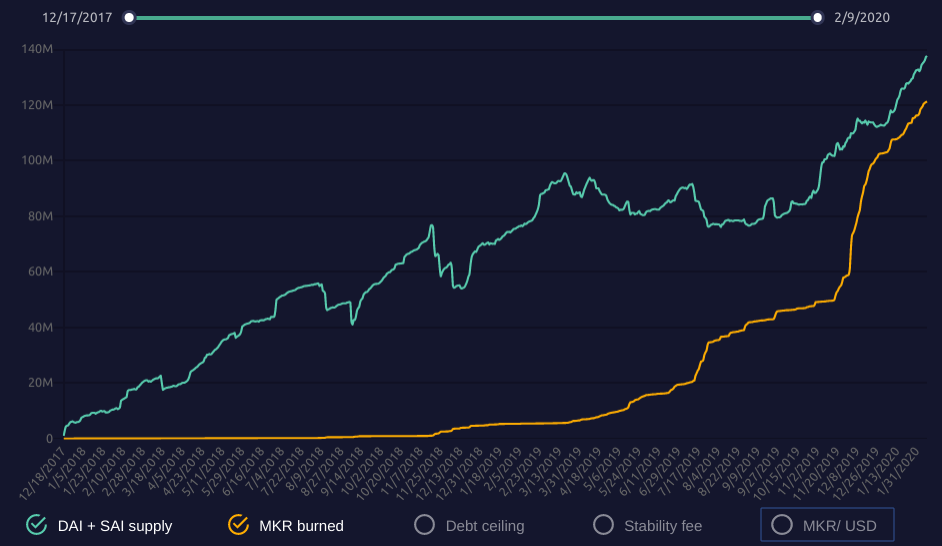
(Above) Graphic via MakerBurn
Despite USD-denominated prices remaining fairly stagnant, this is largely due to Ether’s poor price performance over the past years. When looking at MKR’s performance in the lens of Ether, it has actually done relatively well as the asset is up 124% in ETH terms since January 2018.
The rest of the tokenized money protocols, 0x, Aave, and Augur, all have off-the-chart PE ratios that are pretty much unfathomable in traditional capital markets. With that, we can assume that these protocols likely either need to garner a significant more amount of usage to accrue cash flows or a token economic rework to capture the value from the usage and protocol fees.
Comparing to CeFi
While open, permissionless money protocols are all exciting, we’ve also seen token strategies from major “crypto banks” like Binance and the BNB token.
Every quarter, Binance uses a portion of its profits generated from operations to burn BNB tokens, effectively providing a dividend to BNB holders based on Binance’s quarterly profits. While there’s some controversy in the community on how these token burns are executed (BNB tokens are not purchased on the open market and are burned from the ICO reserve that have never been in circulation), it does provide some color on how a centralized, permissioned crypto bank stacks up to decentralized, permissionless money protocols in terms of annualized earnings. Binance severely outpaces them.
In the last four quarterly burns, Binance has driven nearly $115 million in profits towards burning BNB tokens.

The ~$115M in annualized earnings allocated towards BNB tokens with its $2.83B liquid market cap puts BNB’s PE ratio at 17, a reasonable ratio for one of the highest valued tokens in the space.
While these earnings are impressive, it’s important to note that BNB tokenholders do not have the legal protections as equity holders and the value driven via token burns is not protected by legal rights. We’ve seen this become problematic with the change in literature in Binance’s whitepaper on how these token burns are executed. As such, investors should always be cautious with the centralization risks associated with these token systems. (RSA—we’ll do an article on “loyalty coins” soon!)
Bonus—Two Thought Experiments
1: What if DAI hit $400b?
My rookie Bankless article—“The Trillion Dollar Case for ETH”—outlines the potential for Dai in several hypothetical scenarios. The idea—if Dai captures just a slice of the global money supply, we’ll need billions in circulating Dai (if not trillions).
So how would MKR be affected in these scenarios? With the PE ratios for Maker, the fee rate from the spread, and the circulating amount of Dai, we can forecast the price of MKR under these scenarios with a little bit of algebra.
Our formula for calculating the price of MKR is:
Liquid Market Cap = Earnings * PE Ratio
If Dai captured…
- 51% of Argentina’s M1 supply = 13b
- 1% of the US M1 supply = 40.3b
- 10% of United States M1 supply = 403.4b
And if we assume…
- Spread: 0.25%
- PE ratio: 80
- MKR supply: 1,000,000
Then we get…
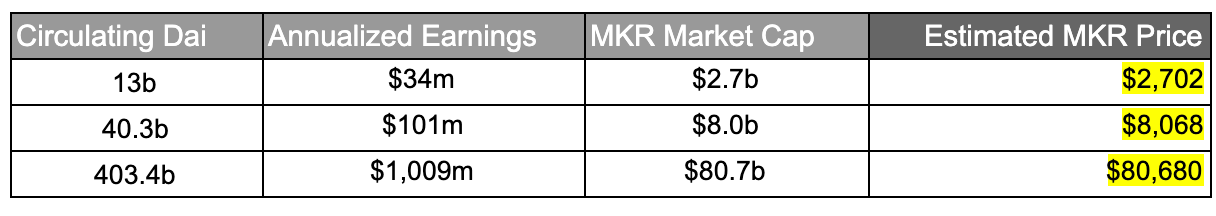
10% of U.S. M1 means MKR price is passes $80k. (MKR currently trades at $609)
As with my last article, the numbers above just to give you an idea on how MKR would be valued in the future and should be taken with a grain of salt. The estimated MKR price does not take into account the MKR burned in the past and is simply calculated from the fully diluted supply of MKR. In addition, the Dai Savings Rate, the Stability Fee, and the underlying spread are all subject to change in the future.
Moreover, the PE ratio will also change if these numbers come into fruition. Investors may price MKR with a lower PE ratio as expectations of future growth drop if Dai continues to capture more of the existing money supply (and there’s less of it to capture in the future).
The opposite could be true as well—investors may price MKR higher if the narrative of Dai as a global, permissionless store of stable value takes hold and the market believes there’s significant growth opportunities ahead.
2: What if Uniswap was tokenized?
Uniswap has quickly established itself as one of the leading permissionless liquidity protocols on Ethereum. In 2019 alone, Uniswap accrued over $1.69M in fees. However, despite the fact that it has distributed millions in fees to its liquidity providers, it lacks a native token.
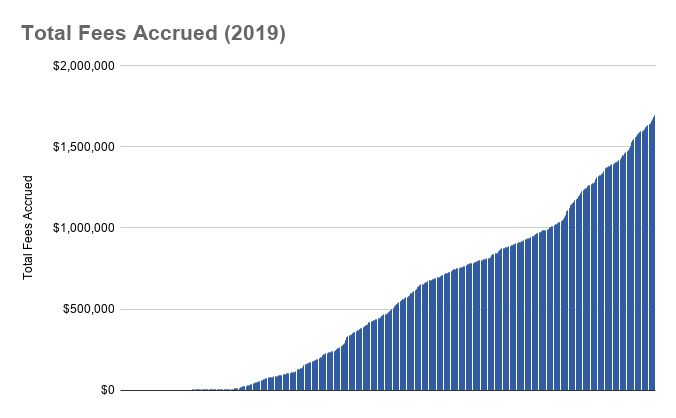
(Above—graph via DeFi Rate “Uniswap to $1b?”)
Let’s assume that Uniswap decides to integrate a native token in the future. What would be “fair value” and where would it stand in terms of liquid market cap?
First, let’s design a quick token economy for Uniswap that accrues value from the exchange fees like this:
In order to become a Uniswap liquidity provider and have the right to the protocol’s cash flows, users must hold x amount of UNI tokens.
Not elegant, but simple. UNI would represent the right to fees from Uniswap.
So where would Uniswap fall in terms of market cap given the current ~$1.69m in earnings?
Looking at its closest competitor Kyber Network with a PE ratio of 31, Uniswap tokenized liquid market cap would reach $52.39M. That said, Uniswap has had explosive growth in the past year and investors may value its token slightly higher in terms of PE ratio. Let’s bump PE to 50.
At PE of 50 Uniswap’s liquid market cap would reach $84.5M, surpassing Kyber’s which is currently ~$76M.
Just for fun, let’s raise the PE ratio to 100 (which is still less than half of Tesla’s). Uniswap’s liquid market cap would hit $169M, putting it in range of other DeFi protocols like Augur (~$158M) and Synthetix (~$185M).
Conclusion
PE ratios for DeFi tokens makes sense given many of these money protocols generate cash flows and in turn, hold similar properties as traditional capital assets.
Importantly, DeFi tokens are unlikely to accrue monetary premiums (maybe SNX) as they’re mainly fueling the underlying protocol and not used as a reserve asset or a store-of-value.
So looking at these DeFi tokens in the lens of traditional capital assets seems fair. Tokens like Synthetix and Nexus Mutual have fairly low PE ratios, indicating that usage is high relative to its market cap. This could mean they’re either undervalued by the market at large or have little growth expectations ahead (which is unlikely given how nascent DeFi is and the potential it holds).
On the other hand, tokens like Augur and 0x have absurdly high PE ratios, meaning that these money protocols are having a tough time accumulating significant cash flows relative to their market cap. It seems crypto investors are either (1) overvaluing these assets or (2) have extremely high future growth expectations.
Regardless, looking at DeFi tokens in the lens of PE ratios can give investors a much clearer picture on usage and potential investment opportunities ahead.
It’s also become apparent that our nascent industry has a long way to go before we can compete in terms of cash flows with permissioned crypto banks and even farther for traditional companies.
Author Blub
Lucas Campbell is an Analyst at Fitzner Blockchain Consulting & DeFi Rate. He fell down the crypto rabbit hold while studying economics at CU Boulder and ultimately became a board member for CU Blockchain. I discovered Lucas while reading his Token Tuesdays newsletter where he covers topics related to tokens and DeFi (recommended!)
Subscribe to Bankless. $12 per mo. Includes archive access, Inner Circle & Deal Sheet.
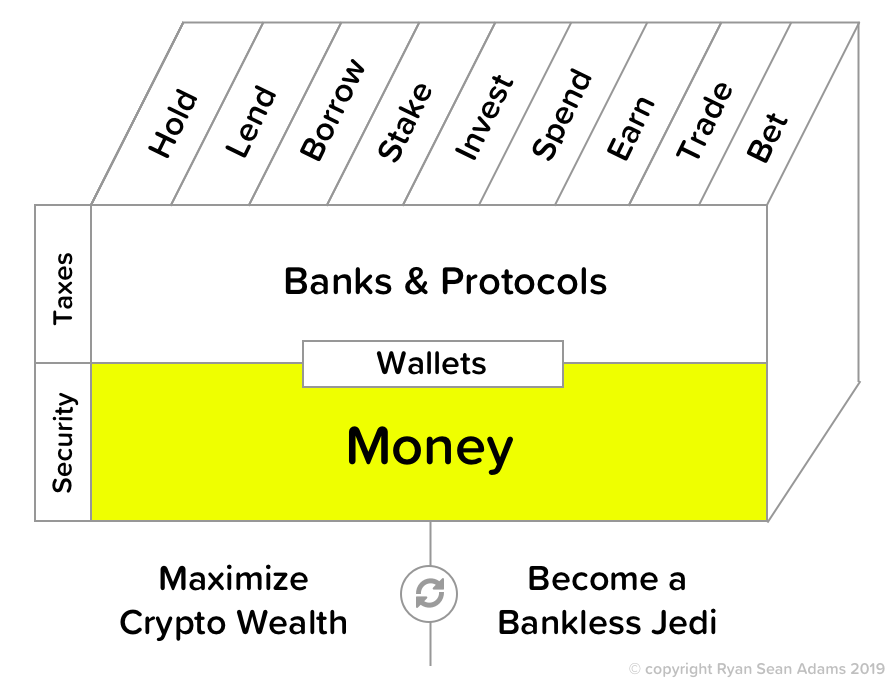
Filling out the skill cube
This piece is about “bank bets” in the crypto money portfolio—you learned how to evaluate DeFi protocols like you’d evaluate stocks. Keep leveling up on the skill cube!
Not financial or tax advice. This newsletter is strictly educational and is not investment advice or a solicitation to buy or sell any assets or to make any financial decisions. This newsletter is not tax advice. Talk to your accountant. Do your own research.
Disclosure. From time-to-time I may add links in this newsletter to products I use. I may receive commission if you make a purchase through one of these links. I’ll always disclose when this is the case.