When Bitcoin Moon?

Level up your crypto finance game five times a week. Subscribe to the Bankless program below.
Dear Bankless Nation,
It’s been nearly 6 months since the Bitcoin halving.
So when moon?
Benjamin Cowen gives the crypto quant take.
He takes BTC’s historical price data from the past decade and uses data science and predictive models to draw 5 key conclusions.
This’ll give you a better idea on where we’re at in the market cycle.
Not much more time to accumulate your crypto money.
- RSA
🙏Sponsor: Aave—earn high yields on deposits & borrow at the best possible rate!
WRITER WEDNESDAY
Guest Writer: Benjamin Cowen, Founder of Into The Crypto Verse

Investing in Bitcoin over the last decade has dwarfed the returns on most other investment vehicles.
While a quick look at the Bitcoin chart over a short time frame can look somewhat daunting, it’s because short-term price movements can best be attributed to a random walk or geometric Brownian motion.
Traditional technical analysis is often riddled with disclaimers at every turn, and for every type of price movement that resembles some sort of textbook pattern, there are countless others that don’t play out “according to plan.”
Alternatively, a macro view of BTC price trends yields something that is a bit more dissectible using data science. A quick analysis shows that it’s experiencing market cycles that have yielded subsequently lower ROIs while taking longer to realize these ROIs. In other words, BTC’s macro trend indicates lengthening cycles with diminishing ROIs on each market cycle.
In cases where an annual loss can exceed 80% after a speculative bubble, it does give credence to the idea that timing the market is also important, and not just time in the market.
The time value of money is critical during a period when we’re racing to simply beat inflation.
1. Bitcoin is in a “fair value” phase

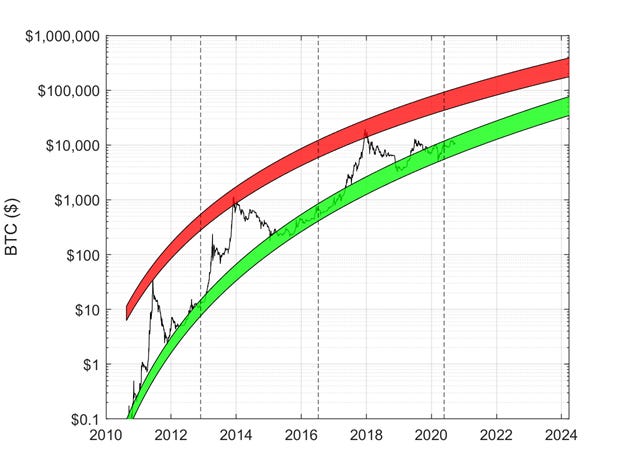
Figure 1: Logarithmic regression fits to non-bubble data (green regression band) and speculative bubble peaks.
The graph above shows the price of Bitcoin and a logarithmic regression fitted to “non-bubble” data and speculative bubble peaks. When looking at the price from a high-level, accumulation ranges and speculative bubble formations become significantly easier to identify.
To better understand these trends, we can calculate the percent difference between the price and the fair-value logarithmic regression fit, which is a monotonically increasing function (Fig. 2).
2. Market cycles are becoming less explosive
The graph below shows that the speculative bubble formation with reference to the fair value regression band is becoming less and less explosive during each subsequent peak.
In fact, the percent difference between the first peak in 2011 and the logarithmic regression band is approximately 6,000%, whereas the second peak in 2013 is only about 3,000% above the band.
The third speculative bubble in 2017 peaked approximately 1,000% above the regression band. While three data points can certainly not make a definitive trend, we at least can speculate on the data we have so far. For instance, 6000/3000 = 2 and 3000/1000 = 3. If this trend continues (which of course is a big if) and we see a division by 4 from the third bubble to the fourth, we may expect to see the price of Bitcoin overvalued by approximately 250% in approximately three more years (2023).

Figure 2: Percent difference of the price of BTC and the “fair-value” logarithmic regression fit to non-bubble data.
If Bitcoin is overvalued by 250% in 3 years, we can identify an approximate corresponding price for the asset. Based on our current regression band, the fair value of Bitcoin will be approximately $40,000 in 3 years.
If the price of Bitcoin is overvalued by 250%, then we may expect the next bubble top to be around $140,000. Of course, there’s a large amount of uncertainty in this and the actual peak can vary by thousands of dollars.
But hey, what’s a few thousand among friends?
3. Each market cycle is longer than the last
Now you may be wondering where the idea of lengthening cycles comes from.
After all, the crypto community has mostly preached about BTC’s “four year cycle.” However, there’s essentially zero evidence to support this idea other than the fact that most cycles have been at least four years. Because of this, so many investors suffer from recency bias, rather than looking at what the data suggests.
Instead of identifying what the data says and writing the narrative, many write the narrative and manipulate the data to support it. A quick glance at Fig. 3 shows that cycles are lengthening whether measured from bottom to bottom, bottom to top, or top to top.

Figure 3: Running one-year ROI of the price of BTC.
Another way we can show lengthening cycles is the running one-year ROI or the price of Bitcoin (Fig. 3).
4. The highest probability for BTC’s peak is in 2023
Instead of measuring from the market cycle bottom, we only showing the ROI on a one year running window; meaning calculating BTC’s price 1x per year. This shows us another perspective in which movements away from the general macro-level downtrend are taking longer each cycle.
The next cycle has the highest probability of peaking in 2023, with the earliest being the end of 2022 and the latest being the middle of 2024. Clearly no one can tell you exactly when Bitcoin will reach that new paradigm shift, but we can at least prepare for the idea that the peak will likely be much later than 2021.
If we present the data discretely by annualizing the price of Bitcoin, we can observe several expansion and contraction phases. Fig. 4 shows us general times where the price of Bitcoin trends upwards or downwards on an annualized scale. The trend suggests that we are likely going to start pivoting soon to an expansion phase that will last several years.
That said, annualizing price data may bring a bit of injustice since it’s an arbitrary way to present the data; however, the contention here is that is just one more tool we have to better understand the macros trends in Bitcoin’s price.

Figure 4: Annualized visualization of expansion and contraction phases of the price of BTC.
5. We’re towards the end of an accumulation phase
Since we cannot accurately predict exactly when the price of Bitcoin will peak or what the price we will be, I developed a risk metric for Bitcoin to better identify accumulation ranges and speculative bubbles.
Fig. 5 shows the price of BTC, but color coded by the risk metric. While the gut reaction may be to go “all-in” or “all-out” at certain phases, the systematic strategy is dynamic dollar cost averaging, where one increases buys as the risk drops closer to 0, and scale up the sells as the risk approaches 1.

Figure 5: BTC price vs. time with color-coded risk, a metric for identifying periods of accumulation and speculative bubbles.
Closing Thoughts
Obviously all of these graphs, data points, and conclusions should be taken with a grain of salt. No one can tell you when exactly BTC will peak in price or when the perfect time to buy is.
But we can use math to help us better identify where we are on the macro scale. At the end of the day, the data suggests a few core takeaways:
- BTC is fair valued based on the regression band
- ROI from each bull cycle is going down
- There’s lengthening market cycles
- We’re likely years away from another price peak
- BTC may be nearing the end of an accumulation phase
With all of that in mind, we only have three market cycles to pull from. We still need (a lot) more data in order to draw more accurate conclusions.
Something that can only happen with time.
Action steps
- Understand where BTC stands on a macro perspective
- Read Bitcoin’s scarcity game to learn the game of Bitcoin accumulation
- Check out IntoTheCryptoVerse for more content like this!
Author Bio
Benjamin Cowen has a B.S. in mathematics and a PhD in nuclear engineering. He uses his skillset to provide analysis using data science and quantitative finance which is regularly published on his Youtube Channel. He also provides premium analysis via his website.
Subscribe to Bankless. $12 per mo. Includes archive access, Inner Circle & Badge.
🙏Thanks to our sponsor
Aave
Aave is an open source and non-custodial protocol for money market creation. Originally launched with the Aave Market, it now supports Uniswap and TokenSet markets and enables users and developers to earn interest and leverage their assets. Aave also pioneered Flash Loans, an innovative DeFi building block for developers to build self-liquidations, collateral swaps, and more. Check it out here.

Not financial or tax advice. This newsletter is strictly educational and is not investment advice or a solicitation to buy or sell any assets or to make any financial decisions. This newsletter is not tax advice. Talk to your accountant. Do your own research.
Disclosure. From time-to-time I may add links in this newsletter to products I use. I may receive commission if you make a purchase through one of these links. I’ll always disclose when this is the case.