How to read onchain data (part 2)
Level up your open finance game three times a week. I’m releasing this Free for Everyone until November 1. Get the Bankless program by subscribing below.
Dear Crypto Natives,
We have unfinished business this Tactics Tuesday! Last week was part 1 in our How to read on chain data series. Today is part 2.
Remember why we’re doing this: so we can track the fundamentals of our main money bets—BTC and ETH. And also, so that we can keep our eyes peeled for up and coming crypto assets that are beginning to show real traction.
After part 2 you’ll know the basics of how to read fundamental onchain data metrics.
Ready? Let’s level up!
- RSA
TACTICS TUESDAY:
Tactic #7:
How to read onchain data (part 2)
Learn the basics of interpreting onchain data for ETH and BTC using key metrics provided by CoinMetrics. Evaluate these metrics on a regular basis to reassess and understand the fundamentals of your crypto money bets.
This is a two-part tactic. Today is part 2. Here’s part 1 if you missed it.
- Goal: Learn how to interpret onchain data for ETH and BTC using CoinMetrics
- Skill: Intermediate
- Effort: 1 hour
- ROI: Make better crypto money bets based on fundamental metrics
Let’s pick up where we left off…
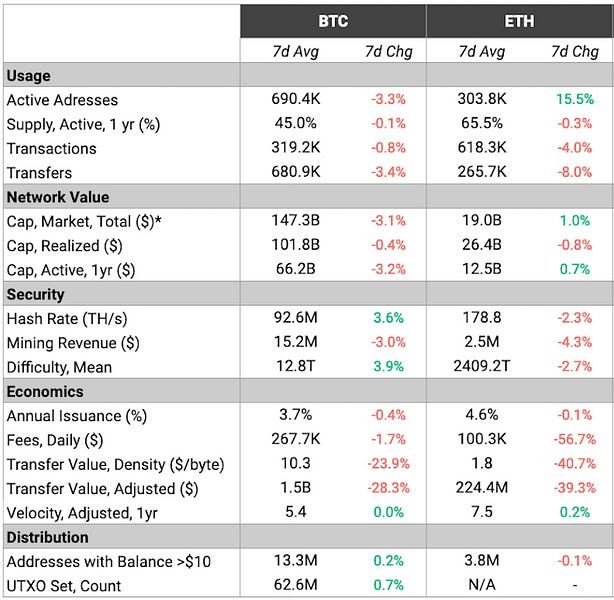
Here’s our table from last week:
(7-Day data from September 30th, 2019 to October 6th, 2019)
We covered the first 11 metrics last week. Today, we’ll tackle the remaining 10.
Before you start:
👉Open the chart in a new browser window so you can refer to it as we go.
Reminder note: Remember some of these metrics are not directly comparable between Ethereum and Bitcoin—hash rate is one example. Since BTC and ETH use different proof-of-worth algorithms it’s not useful to compare this metric. But other metrics like annual issuance and daily fees, well, compare away!
Security Metrics
Security metrics relate to the cost to attack the Bitcoin and Ethereum network.
Hash Rate
Hash rate is an estimate of the total compute power securing BTC and ETH.
Remember that proof-of-stake networks are secured in part by specialized computers competing against each other to solve mathematical puzzles—this is called mining. And hash rate is a measure of the total compute power mining in these networks.
It’s also a measure of security. Why?
A 51-percent attack can reverse transactions in a crypto network—but a high hash rate secures the network against such an attack. The higher the hash rate the greater the number of miners required to carry out a 51-percent attack. In a healthy network, the rate increases over time.
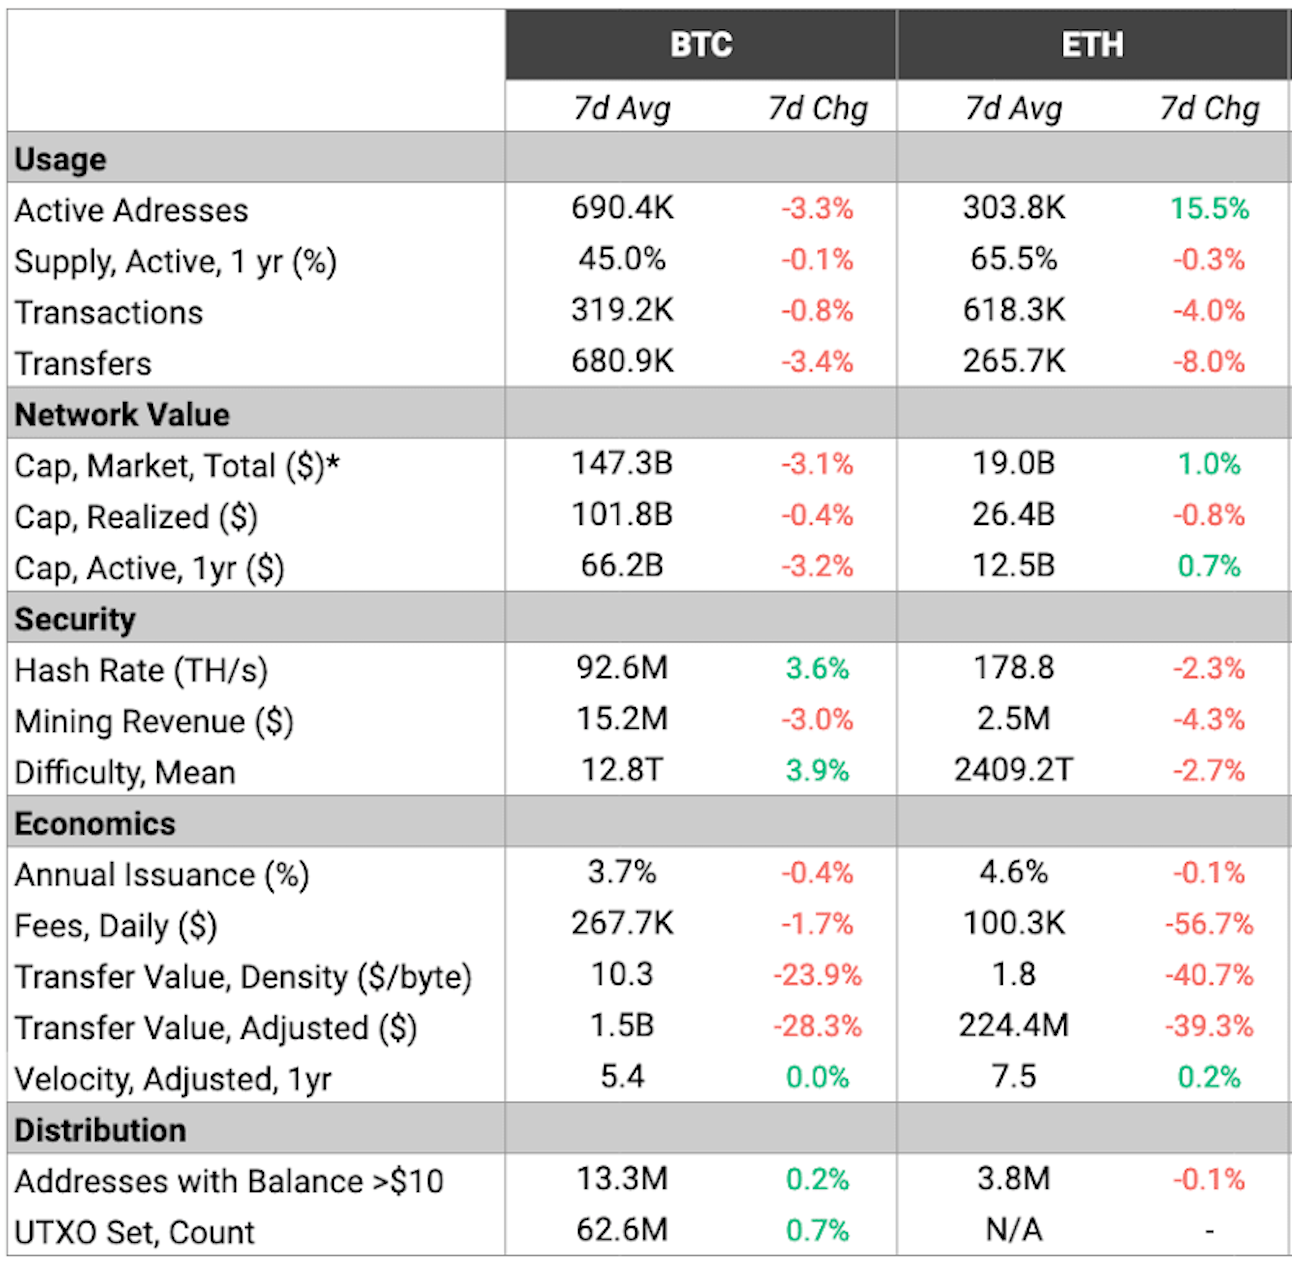
- BTC 92.6m terahashes / second (up 3.6% from previous week)
- ETH 178.8 terahashes / second (down -2.3% from previous week)
Of course BTC and ETH hash rates cannot be compared against one other—they use entirely different algorithms. So you should evaluate BTC’s hash rates only against its own history, not against ETH’s.
👉See BTC’s historical hash rate
👉See ETH’s historical hash rate
You’ll see BTC’s hash rate is close to all-time highs while ETH’s hash rate is below 2018 levels. The drop in ETH hash rate might be caused by a variety of factors—falling price, ETH’s recent decrease in block rewards, or less general willingness by miners to invest in mining due to Ethereum’s future transition to proof-of-stake.
Mining Revenue
A measure in dollars of total revenue received by miners for securing Bitcoin and Ethereum.
Miners get paid in block rewards and transaction fees to secure BTC and ETH. This mining revenue is the incentive driving miners to do what they do.
Since hash rate tends to follow economic incentives, mining revenue is a more holistic metric for security than hash rate. All else equal, the network with the highest mining revenue is the most secure. Mining revenue is the network’s security budget.
- BTC $15.2 million per wk in mining revenue (down -3% from previous week)
- ETH $2.5 million per wk in mining revenue (down -4.3% from previous week)
The mining revenue of BTC vs ETH is much more comparable than hash rate. Today BTC is roughly 6x more secure on this measure than ETH. For much of 2017 and part of 2018 these networks were far closer on this metric. More recently, ETH’s mining revenue has fallen relative to BTC mostly due to ETH’s deeper price drop and its block reward thirdening in early 2019.
Take a look at these graphs:
👉See historical BTC and ETH block reward revenue
👉See historical BTC and ETH historical fee revenue
Note: Mining Revenue is the sum of both block reward revenue (e.g. issuance) and transaction fee revenue above—the sum of both graphs.
Block rewards are the bulk of miner revenue for both networks. Not transaction fees.
You’ll also notice in the above graphs that while block reward revenue of BTC has outpaced ETH, transaction fee revenue between the networks is much closer. This means demand to use the networks—demand for blockspace—is roughly equivalent between the networks. It also means that speculative demand for ETH as an asset is lower than speculative demand for BTC as an asset right now.
Interesting right?
A key insight—demand for ETH and BTC as an asset is not the same as demand for Ethereum and Bitcoin blockspace—these are separate markets: asset and blockspace—yet both of these markets contribute to the security of their networks.
EXTRA READING: What will happen to Bitcoin as block rewards decrease?
As block rewards in Bitcoin diminish per its halving schedule the Bitcoin network will cease to be secured by the market value of BTC as an asset and will need to be secured instead by the demand for blockspace on the Bitcoin network—this is likely to cause a decrease in Bitcoin security. Hasu explores in his paper here.
Mean Difficulty
This measures the difficulty of mining in the Bitcoin and Ethereum networks.
The difficulty is auto adjusted by the protocols based on how much hashing power is being deployed by miners—more hashing power leads to higher difficulty.
- BTC 12.8 terahashes average (up 3.9% from last week)
- ETH 2,409 terahashes average (down -2.7% from last week)
You can look at historical difficulty for BTC here and for ETH here. Truthfully, I don’t usually spend much time on this metric.
Economics
Economic metrics relate to the supply and value throughput of Bitcoin and Ethereum.
Annual issuance
This is the annual rate of new issuance—the supply inflation of BTC and ETH.
Both BTC and ETH mint new coins to fund the security of their networks. This takes the form of block rewards provided to miners.
- BTC 3.7% annual issuance (flat from previous week)
- ETH 4.6% annual issuance (flat from previous week)
You’ll notice both networks have similar supply inflation rates right now. In the first half of next year Bitcoin issuance will be cut in half to 1.85%. It’s projected to be cut in half roughly every four years after, approaching 0% annual issuance. Bitcoin currently has a fixed issuance schedule and therefore a fixed budget for block reward funded network security.
Ethereum’s issuance isn’t fixed. Instead, issuance on Ethereum is the minimum necessary to secure the network. Sometime after ETH 2.0 ships, Ethereum issuance is likely to drop to the 1% range. Burn mechanisms may decrease issuance further still, possibly below 1% depending on network usage. Ethereum’s security will always be funded mostly through block rewards.
The issuance schedules of both networks have tradeoffs.
Daily Fees
Average daily transaction fees paid for the 7-day period.
This is a measure of how much users are paying for blockspace on Bitcoin and Ethereum. It’s also the daily transaction fee revenue received by miners.
- BTC $267k in transaction fees (down -1.7% from previous week)
- ETH $100k in transaction fees (down -56.7% from previous week)
A few notes of interest:
First, ETH fees don’t usually decrease -56.7% in a week—this was due to a heavy gas consuming Ponzi on Ethereum that suddenly ceased operations. Second, BTC and ETH are virtually the only networks people are paying to use right now—to see what I mean look at all crypto networks sorted by daily fees. Third, BTC and ETH are fairly close on this measure—we saw this when we looked at miner transaction fee revenue—it means blockspace demand on the two networks is fairly equal at the moment.
👉See historical BTC and ETH daily fees
Transfer Value Density & Transfer Value (Adjusted)
I’ve combined these into one section because they’re related.
Transfer value is the value in USD of BTC and ETH transferred from one address to another that day (adjusted to remove noise). It’s a measure of how much economic value in BTC or ETH is being settled onchain.
- BTC $1.5b in daily BTC value transferred (down -28.3% from previous week)
- ETH $224m in daily ETH value transferred (down -39.3% from previous week)
This metric doesn’t count all the ERC20 tokens that are transferred on Ethereum. Just ETH itself. But since BTC and ETH are both the trustless reserve assets of their respective networks, I think it’s fair to compare them on this metric.
For a few brief days in 2017 and early 2018 ETH surpassed BTC in value transferred but has since lost ground. This makes sense given value transferred is highly correlated with price. (And lower price is lower economic bandwidth!) I like this metric because it shows how much trustless value is moving through the pipes of these crypto networks.
👉See historical BTC and ETH transfer value
Ok, so Transfer Value Density? That’s a measure of how much BTC or ETH value is contained in a byte of blockspace.
- BTC $10.3 per byte of blockspace (down -23.9% from previous week)
- ETH $1.8 per byte of blockspace (down -40.7% from previous week)
Some chains fit more bytes per block than others. BTC famously has remained at 1mb per block while forks like BCH have expanded capacity to 32mb per block. For me, there’s less value in comparing BTC vs. ETH on this density metric and more value in comparing similar networks like BTC vs. BCH as this seen in this analysis.
Velocity (Adjusted)
Amount of times BTC and ETH have changed hands over the course of a year.
- Each BTC changed hands 5.4 times per year (flat from previous week)
- Each ETH changed hands 7.5 times per year (flat from previous week)
Much has been written about crypto asset velocity. Some believe high velocity decreases value, less holding means lower price. Others believe velocity is a tautology, a variable in a formula that doesn’t tell us anything new.
I tend to glance at velocity from time-to-time, compare it to the velocity of M1 USD (which is currently 5.6), ponder briefly how much it matters, then move to the next metric.
Distribution
Distribution metrics relate to the distribution of assets in Bitcoin and Ethereum.
Addresses with Balances > $10
Sum of Bitcoin and Ethereum addresses with more than >$10 in BTC or ETH
This may be a measure of wealth distribution in Bitcoin and Ethereum. It doesn’t measure ERC20s of course. And once again BTC and ETH can’t be directly compared given BTC uses UTXO addresses and ETH is account-based.
- 13.3m BTC addresses with >$10 (flat from previous week)
- 3.8m ETH addresses with >$10 (flat from previous week)
Note that a single address can represent an entire crypto bank or a single person. And a person can have as many addresses as they like. Given all these factors, it’s difficult to draw wealth distribution conclusions. However, a higher number is possibly a sign of greater wealth distribution.
I monitor this metric but don’t do much with it yet.
UTXO Count
Measure of the number of unspent Bitcoin transactions outputs.
This is not a metric I track often. It also does not exist for Ethereum. Fine to skip it. Or you can dig in here.
Final Thoughts
If you made it this far and did part 1 you now know how to read 17 fundamental onchain data metrics for BTC and ETH—that’s a big deal!
And you can practice them on a weekly basis as soon as CoinMetrics publishes them. These are a foundation. You can later build on them with more complicated metrics like NVT and MVRV ratios—but don’t worry about those until you’re comfortable with everything on the summary table.
This is the kind of stuff I wish I had when I started.
Use it well. Keep leveling up.
Action steps
- Review and understand all 17 metrics in the CoinMetrics summary table
- Sign up for the CoinMetrics newsletter (if you didn’t do this last week!)
Level up—no interruption. $12 per mo. 20% off includes Inner Circle & Deal Sheet.
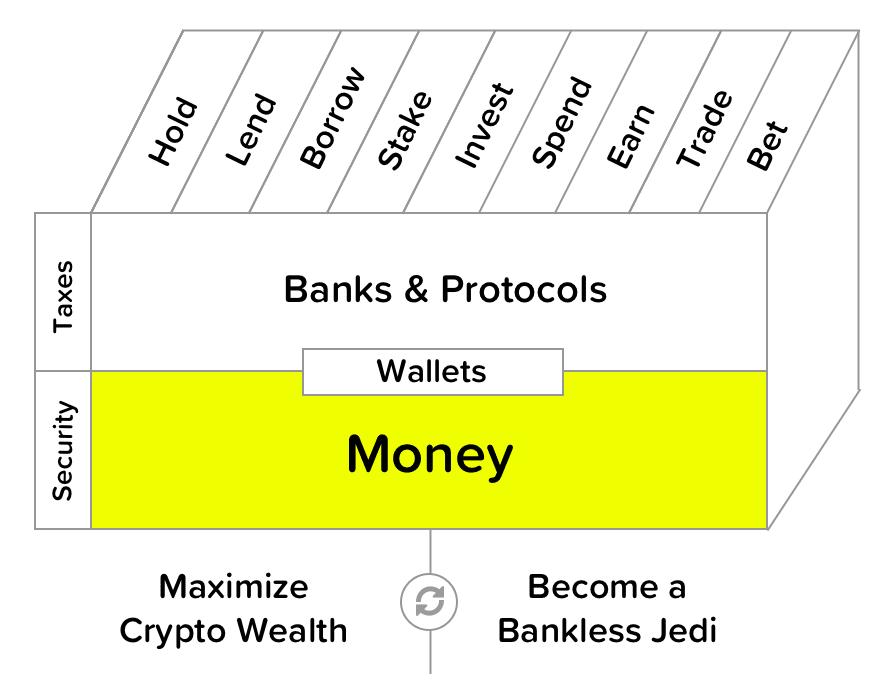
Filling out the skill cube
You leveled up on Money layer of skill cube! Understanding and reviewing ETH and BTC onchain metrics will help you make better crypto money bets.
Not financial or tax advice. This newsletter is strictly educational and is not investment advice or a solicitation to buy or sell any assets or to make any financial decisions. Do your own research.
Disclosure. From time-to-time I may add links in this newsletter to products I use. I may receive commission if you make a purchase through one of these links. I’ll always disclose when this is the case.