How to read onchain data (part 1)
Level up your open finance game three times a week. I’m releasing this Free for Everyone until November 1. Get the Bankless program by subscribing below.
Dear Crypto Natives,
It’s Tactics Tuesday! Really excited about this two part tactic.
The public data produced by crypto money ledgers provides a lot of clues on the traction and growth of these systems. It’s there for everyone to see.
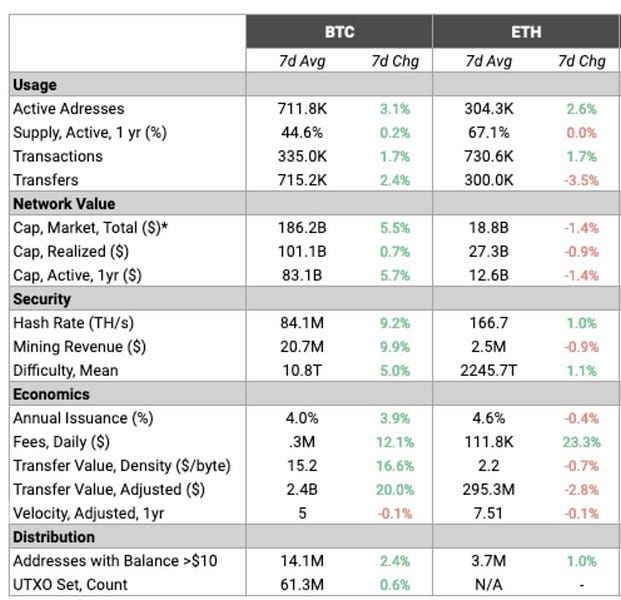
I recently tweeted this:
Today we’re going to look at the metrics above and learn how to interpret them.
Why?
So we can track the fundamentals of our BTC and ETH money bets, which compose the largest portion of our crypto money portfolios. We need fundamental signals beyond basic price to continuously reassess our thesis and keep our eyes open to the emergence or decline of crypto commodity monies.
So let’s dig in and level up!
- RSA
TACTICS TUESDAY:
Tactic #6:
How to read onchain data (part 1)
Learn the basics of interpreting onchain data for ETH and BTC using key metrics provided by CoinMetrics. Evaluate these metrics on a regular basis to reassess and understand the fundamentals of your crypto money bets.
This will be a two-part tactic. Today is part 1.
- Goal: Learn how to interpret onchain data for ETH and BTC using CoinMetrics
- Skill: Intermediate
- Effort: 1 hour
- ROI: Make better crypto money bets based on fundamental metrics
Reviewing onchain data as a habit
I’ve gotten into the habit of looking at this summary metrics table produced by CoinMetrics on a weekly basis. Here was yesterday’s table:
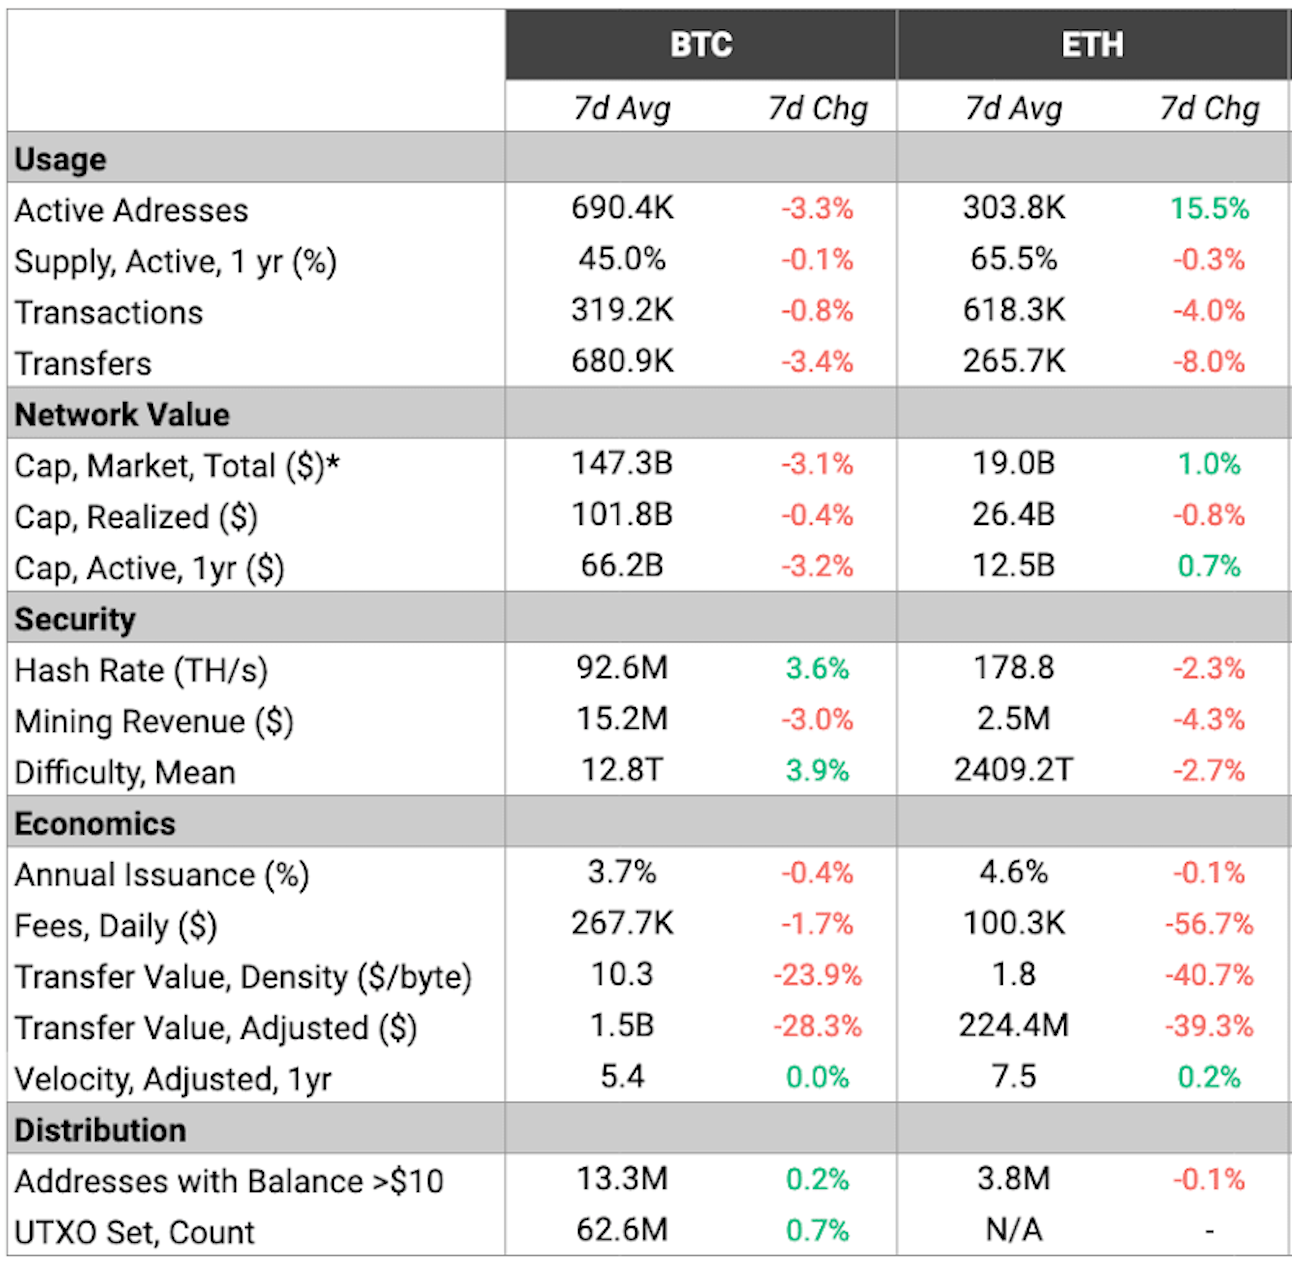
(7-Day data from September 30th, 2019 to October 6th, 2019)
The above 17 metrics tell a lot about the health of ETH and BTC. We’ll tackle 7 of them in part 1. In part 2, well get to the rest.
Before you start:
👉Open the chart in a new browser window so you can refer to it as we go.
These metrics are generated from a combination of onchain data and price data. For ETH and BTC they are relatively difficult to game. Of course, there are some good Ethereum metrics missing, for instance it’s good to look at network utilization and total gas used to understand relative smart-contract usage, but many of the fundamental metrics are captured in the table.
Let’s start with the Usage metrics.
Note: I focus on BTC and ETH because nothing else has earned a place in my crypto money portfolio—but CoinMetrics publishes a version with more assets if you’re interested.
Another note before you dive in: While it’s useful to compare BTC and ETH, it’s important to remember this is not an apple-to-apples comparison. Bitcoin for instance is a monoasset settlement network, BTC only. While Ethereum is a polyasset settlement network, ETH plus other tokenized assets. Ethereum has an expressive smart-contract system & an account-based model, BTC has a simple scripting language & a UTXO model. Differences like these mean metrics like active addresses and transactions can have different interpretations from one network to the other.
Usage Metrics
Usage metrics relate to the actual use of the Bitcoin and Ethereum networks.
Active Addresses
Average number of unique daily active addresses in the network over the 7-day period.
An address can represent an individual, a money protocol, a crypto bank, a company—any participant in the network. In BTC, a new address is generally created for every incoming transfer—most BTC wallets do this by default. Ethereum addresses on the other hand are more like bank accounts, they’re reusable. (This makes it difficult to directly compare active address between each network)
- BTC 690k avg active addresses (down -3.3% from last week)
- ETH 303k avg active addresses (up 15.5% from last week)
Nothing surprising about the numbers this week. At its peak in early 2018 BTC exceeded 1m actives and ETH hit upper 600s. They both in range of this now. It’s also interesting to plot ETH network value vs active addresses—at peak ETH price each Ethereum active address was valued 3x higher than it is today. Overvalued then or undervalued today?
👉See chart for historical active addresses
Active Supply
Active supply looks at the number of units that moved at least one in a 12 month period. Historically, between 40 to 70% of Bitcoin supply changes hands in any 12 month period.
- BTC 45% active supply (about same as last week)
- ETH 66% active supply (about same as last week)
This metric doesn’t usually change much week to week. In December 2018, it was 50% for BTC, in June 2018 it was 57% so has been decreasing of late.
I’m still wrapping my head around the implications of this metric—high active supply could imply less holding and more using of the asset? Low active supply could imply more holding or a greater number of lost coins?
I’d expect ETH to retain higher active supply than BTC as ETH is used in money protocols and for staking. But is higher active supply also an indication of weak hands? As I monitor this metric I’m thinking further about its implications.
Transactions
Means the average number of transactions in the network over the 7-day period.
- BTC 319k avg daily transactions (.8% less than last week)
- ETH 618k avg daily transactions (-4% less than last week)
Dividing this number by seconds in a day gives you the often discussed transactions per second metric—BTC averaged 3.6 TPS while ETH averaged 7.2 TPS last week if you’re curious.
Transaction count metrics are simultaneously underrated and overrated—on networks where transactions are free and permissioned they are vastly overrated. On BTC and ETH, where each transaction is permissionless and costly, they are underrated.
Of course, transaction counts are a good proxy for the number of settlements occurring but they are not a proxy for the economic value of each settlement.
Some observations—in June 2017 Ethereum daily transactions passed Bitcoin daily transactions for the first time and hasn’t been surpassed by Bitcoin since. Both Bitcoin and Ethereum hit capacity limits in their daily transactions during the 2017/2018 bull run, Bitcoin at about 400k daily transactions and Ethereum at 1.2m daily transactions. Incremental improvements have since increased the transaction capacity limits of both networks, though not by much.
The bigger gain—both networks are increasingly used as a settlement layer for crypto banks, consortium sidechains, and layer 2 solutions so more economic value can now be batched up and contained in each transaction. I don’t expect order of magnitude growth in daily transactions until the next version of ETH fully launches, but I do expect each transaction to pack in more value.
Transfers
Refers to the average number of daily transfers in the network over the 7-day period. Transfers are movements of BTC or ETH from one address to another. This means transfers of ERC20s like DAI are not included in the ETH Transfer metric.
Average number of transactions in the network over the period.
- BTC 681k avg daily transfers (-3.4% less than last week)
- ETH 266k avg daily transfers (-8% less than last week)
It’s interesting to look at the transfer counts over time. ETH briefly passed BTC in transfers during January 2018 at over 1m, but transfers on ETH have steeply fallen during the bear market vs BTC. One interpretation—Ethereum network activity during the 2017 frenzy mostly involved transactions for speculative purchases of ETH. Today a higher portion of Ethereum activity involves smart-contract and token assets like DAI, thus transaction counts have rebounded faster than transfer counts.
👉See chart for historical transfer counts
Network Value
Network value metrics incorporate both price data and coin supply.
Market Cap Total
Sum of all BTC and ETH created multiplied by current price.
- BTC $147B market cap (-3.1% lower than last week)
- ETH $19B market cap (1% higher than last week)
Many have opined about the problems of using market cap as a metric. A market cap that’s easily manipulated and not backed by decent liquidity is my biggest issue. That’s less of problem with relatively higher liquidity assets like BTC and ETH.
I like market cap because it’s also a measure of the economic bandwidth of a network, which is the amount of trustless value available to the network. High economic bandwidth is necessary for crypto banks and money protocols that rely on the liquidity and value of BTC and ETH as reserve assets.
The history of BTC and ETH market cap tells an interesting story. One of logarithmic growth for both assets—and ETH growth against BTC in 2016/2017, then a return to BTC dominance in 2018/2019. Zooming out you see a repeating crypto J-curve of boom and bust cycles against USD, with higher lows at then end of each cycle.
👉See chart for historical market cap
Realized Cap
This is the sum of value based on the closing price on the day that the BTC or ETH unit last transacted. Realized cap is a measure of the average cost basis of all BTC and ETH holders.
- BTC $102B realized cap (about same as last week)
- ETH $26B realized cap (about same as last week)
Essentially, realized cap values BTC and ETH at the price they last moved. So it prices the supply at the time holders realized their gains or losses. Since this is a newer metric I’m still early at drawing out the implications. A couple of CoinMetrics weekly reports have gone into detail.
At a market cap of $147B and a realized cap of $102B it would seem that the average BTC holder is in the money right now. It means the average price paid per BTC is around $5,600, not the 2017 bubble prices of $19,000. Also, realized cap is now at an all-time-high for BTC which is impressive.
Meanwhile, ETH realized cap is $26B while market cap is $19B. If this metric is accurate for ETH it means the average ETH holder is still down having purchased at an average price of $175 per ETH. In fact, being underwater has been the situation for ETH holders for over a year now as the market cap of ETH has been lower than realized cap since July 2018. This period marks the first time the resolve of ETH holders has been majorly tested.
Some good news though—while CoinMetrics does not publish ETH realized cap data in its free version yet, the data I’ve seen shows ETH’s realized cap is basically flat over the past two years. This is a good sign. It probably indicates that low cost basis holders aren’t selling. The OGs are believers.
Active Market Cap
Active market cap sums the value of ETH and BTC units that moved at least once in a 12 month period. It translates the Active Supply metric described in the Usage section above to a dollar amount.
- BTC $66B active market cap (-3.2% down from last week)
- ETH $13B active market cap (.7% up from last week)
This means $66B of the $147B in BTC was used for something other than holding in cold storage over the past 12 months.
Final Thoughts
Understanding the fundamental metrics that drive BTC and ETH is crucial to helping you make better money bets and leveling up.
We went through the first 7 metrics in the CoinMetrics table today.
We’ll do the rest in Part 2.
Action steps
- Review and understand the first 7 metrics in the CoinMetrics summary table
- Bonus: sign up for the CoinMetrics newsletter
Level up—no interruption. $12 per mo. 20% off includes Inner Circle & Deal Sheet.
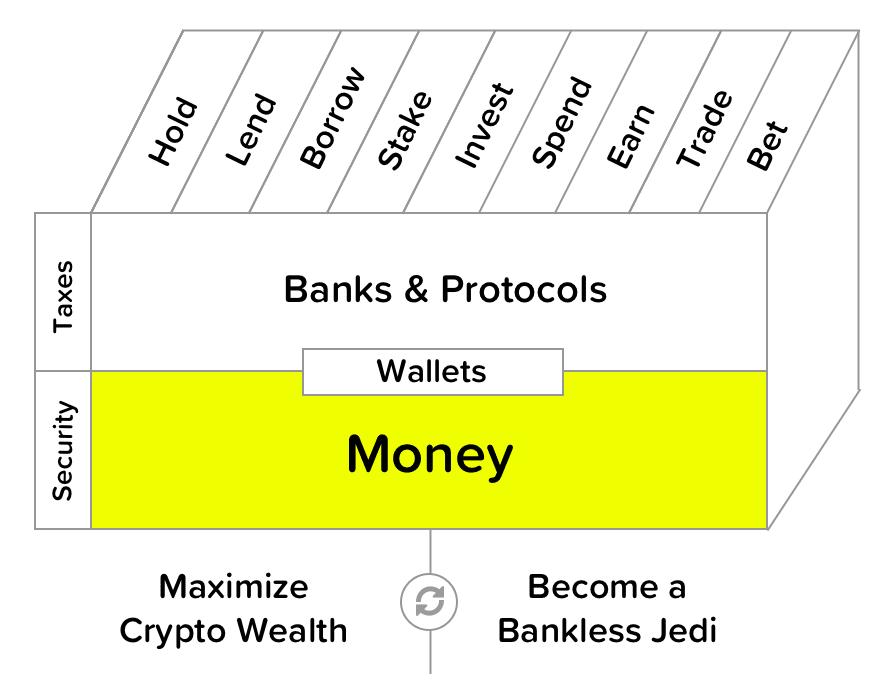
Filling out the skill cube
You leveled up on Money layer of skill cube! Understanding and reviewing ETH and BTC onchain metrics will help you make better crypto money bets.
Not financial or tax advice. This newsletter is strictly educational and is not investment advice or a solicitation to buy or sell any assets or to make any financial decisions. Do your own research.
Disclosure. From time-to-time I may add links in this newsletter to products I use. I may receive commission if you make a purchase through one of these links. I’ll always disclose when this is the case.