How to think about crypto P/E
Level up your open finance game three times a week. Subscribe to the Bankless program below.
Dear Crypto Natives,
I recently tweeted this:
I think many cryptoassets have a big problem.
They’re being priced as if they’ll accrue a monetary premium, yet their investors and creators claim the assets themselves aren’t trying to be a money. But if these same assets are valued based on future earnings—say, the future transaction fees they’ll produce—they’d probably be worth low millions, not the hundreds of millions and billions that people are paying for them.
Is there a way to see this more clearly?
What if we stripped these assets of their monetary premium and looked at them based on future earnings alone? That’s what we’ll learn to do in today’s tactic. We’re going to level up on crypto P/E.
One more thing—don’t get caught up on the precise numbers in the P/E ratios today—the calculations here are an early attempt. This is more about having a framework for thinking about the cryptoasset valuation so you can avoid the lemons and double-down on the winners.
- RSA
TACTICS TUESDAY:
Tactic #18:
How to think about crypto P/E
Price-to-earnings (P/E) ratios have proven a useful way to compare the value of capital assets like stocks and rental properties. Can we use this metric for cryptoassets? I think we can—for certain types.
Today we’re going to walk-through some crypto P/E metrics put together by Mika Honkasalo and how they might apply to different types of assets.
- Goal: Learn a model for thinking about the P/E of cryptoassets
- Skill: Intermediate
- Effort: Spend 30 mins reading this article and reviewing the metrics
- ROI: Avoid overpriced cryptoassets that don’t reflect strong fundamentals
What is a P/E ratio?
Price-to-earnings ratio is a simple formula:
Market cap / earnings
If you buy a stock with a P/E of 20 then it’s costing you $20 for every $1 in annual earnings the company produced over the previous 12 months. Stocks with high growth expectations have higher P/E ratios—investors are willing to pay more for high growth assets. Amazon’s P/E ratio is 84 for example while GE’s P/E ratio is 19. This means the market has higher earnings growth expectations for Amazon. It’s willing to pay $84 for one dollar of Amazon earnings.
As another benchmark: the long-term average P/E for the S&P 500 is 15.
What kinds of assets does P/E apply to?
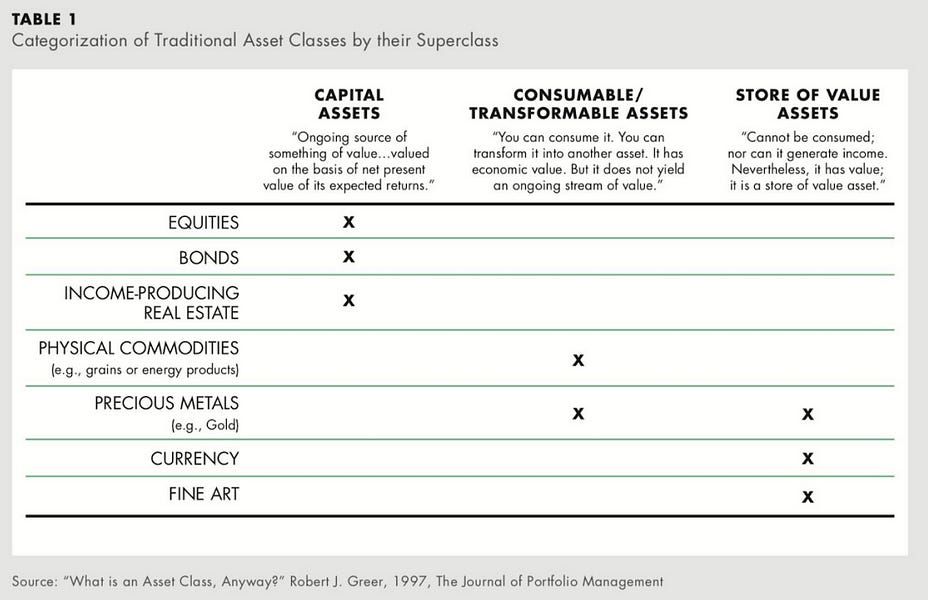
Broadly there are three types of assets:
- Capital Assets—like stocks & real-estate
produce returns, valued as the net present value of expected returns - Consumable/commodity assets—like precious metals & oil
assets that can be transformed into another asset, they don’t generate income, they’re priced based on supply & demand - Store of value assets—like currency or collectibles
assets used to store value, they do not generate income, they’re priced based on supply & demand
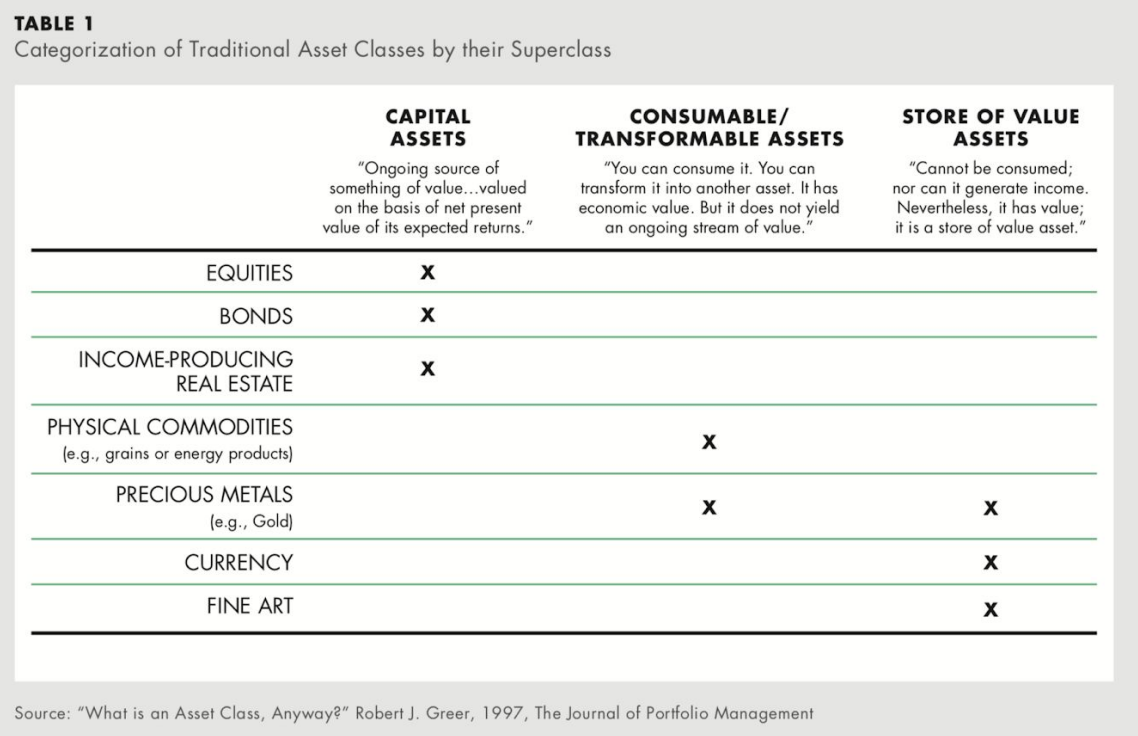
P/E ratios are only relevant to capital assets—stocks in particular, not commodities or store-of-value assets. That’s because only capital assets provide investors a stream of future earnings. Earnings are the E in P/E.
How about cryptoassets?
Cryptoassets can be any of the three asset types above. They can even be more than one at a time. Some examples:
- BTC is a double-point asset—a store-of-value & commodity. It plays the role of store-of-value when it’s held or used as a medium-of-exchange and unit of account. It plays the role of a commodity-like instrument when it’s used to purchase blockspace on the Bitcoin network for transactions (note: the blockspace itself is the commodity, not BTC).
- ETH is a triple-point asset—a store-of-value & commodity & it will become a capital asset in proof-of-stake. Similar to Bitcoin, it is used as a high-powered collateral & reserve value store for its economy. It is also used as the currency to pay for Ethereum blockspace and thus acts as a commodity. Under proof-of-stake it will generate returns as a capital asset.
- MKR and BNB are capital assets—these generate earnings (and also discounts in BNB’s case) based on usage of their respective networks, not unlike stocks.
The lines can be blurry of course. Cryptoassets can lose or increase their moneyness and become more or less of a store-of-value—you could argue BNB is currently used as a type of money within the local Binance economy for instance. And in traditional finance, capital assets like real-estate and stocks are also used to store wealth.
Crypto P/E Ratios
In crypto you can define the P/E ratio as:
Token Market Cap / Earnings
Only cryptoassets that are capital assets have earnings, so only these can be properly viewed through the lens of a P/E ratio. If a token is both a capital asset and store-of-value asset (like ETH), then the P/E ratio only tells the capital asset part of the story.
Mika Honkasalo recently launched TokenTerminal as his take on cryptoasset P/E ratios. It’s a good way to explore P/E in crypto. You can see it live here and below.

Take a minute to look at the last column, the P/E ratio. Remember again, this is just a lens on the earnings aspect of these assets—it does not consider monetary premium. It’s also based on the earnings assumptions Mica made for each asset, a bit rough in places but still very illustrative.
As with stocks a higher P/E ratio indicates higher growth expectations on the asset. It could also indicate the asset is overvalued relative to its peers. Likewise, a lower P/E ratio could indicate lower growth expectations or undervaluation relative to peers.
When you’re looking at P/E it makes sense to group by type:
Layer 1 Basechain P/E ratios:
- BTC: N/A—BTC has 0 earnings as a capital asset
- ETH: 1082—based on annualized protocol earnings (transaction fees only)
- Tezos: 123,425—based on annualized protocol earnings (transaction fees only)
- Cosmos: 74,633—based on annualized protocol earnings (transaction fees only)
At $14.6m or so in annualized protocol earnings from transaction fees, ETH has a P/E ratio of 1082. Mica purposely ignored block rewards as an earnings source here, since he views block rewards as a dilution mechanism for those who do not have their assets validating in a proof-of-stake network. Not sure I completely agree, but at least it’s apples to apples. Tezos comes shows a massive PE, Cosmos as well, both generating under $11k in annual transaction.
A takeaway here—if valued as a pure capital asset ETH is decently overvalued but both Tezos and Cosmos are off the charts overvalued.
Another point—since BTC is a proof-of-work network with tokens that do not entitle holders to a share of network earnings, BTC is shown as a N/A here. But if it were a capital asset then its P/E ratio would be 4,070—even more overvalued than ETH.
The value of these layer 1 basechain assets seems to only make sense if you assume they’ll accrue a high-monetary premium. If it turns out they’re just capital assets, they’re extremely overvalued.
Money protocol P/E ratios:
- Augur: 10,272—based on reporting fees
- Maker: 317—based on interest fees
- Snythetix: 21—based on trading fees
- 0x: 1,573—based on trading fees
- Kyber: 71—based on trading fees
All of these are plainly capital assets. None (except SNX you could argue) are store-of-value assets competing for monetary premium. Augur has maintained a high valuation despite weak earnings so far—only $10k annualized earnings for REP holders—expectations still big. I was actually surprised at the low P/E ratios of Maker, Kyber, and Synthetix. Maker’s earnings are close to the types of P/E you’d see at a high flying tech company—Kyber and Synthetix have even more reasonable valuations under this lens. A Synthetix with $7.75m in annualized earnings is impressive indeed.
Some money protocols are producing!
Exchange token P/E ratios:
- Binance: 60—based savings amounts from trading
- BitFinex: 234—based savings amounts from trading
Truthfully, I’m not sure I followed Mica’s P/E calculations for the exchange tokens.
They are certainly capital assets. But they tokens provide value in two primary ways. First, a portion of their token supply is burnt based on exchange earnings. And second, they provide discounts on exchange services when the tokens are used in the exchanges. I believe Mica is only calculating P/E based on the saving-per-token when used to minimize trading fees.
If you have feedback or want to contribute ideas for different calculations ping him on Twitter @tokenterminal or using this contact form.
You can look at the other assets on this list for yourself.
Finishing Thoughts
Looking at cryptoassets through the lens of P/E means evaluating them based on their productive earning power. This is how capital assets are evaluated in traditional markets and I see no reason why they shouldn’t be evaluated similarly in crypto. Most money protocol and exchange tokens (the “bank bets”) are best viewed as capital assets—P/E is a good lens for these.
However, not all cryptoassets are capital assets. Most base layer assets are competing for monetary premium—they’re competing to become a store-of-value asset like fiat or gold. If they can achieve that, then they should be priced much higher than just the expected value of their future earnings. Thus the current prices of most proof-of-stake layer 1 basechain tokens only make sense if you assume they’ll achieve monetary premium. Remove that assumption and current P/E ratios of layer 1 tokens indicate massive overvaluation. Buyer beware!
Keep this P/E lens handy so you can make your own observations overtime.
Action steps
- Look at P/E ratios on TokenTerminal
- Which cryptoassets are overvalued or undervalued according to their P/E ratios?
Subscribe to the Bankless program. $12 per mo. Includes Inner Circle & Deal Sheet.
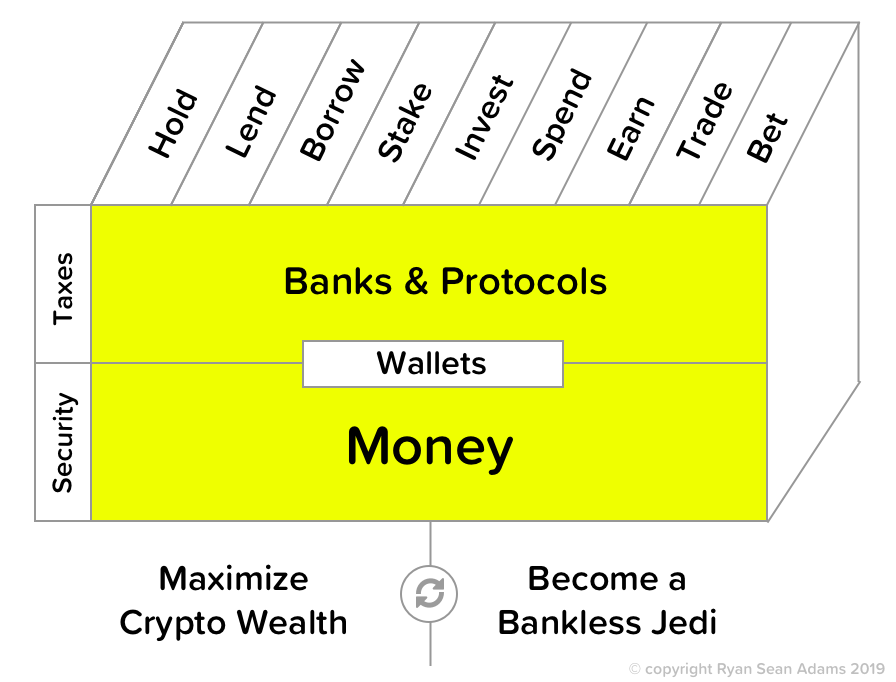
Filling out the skill cube
P/E is a useful tool for analyzing capital assets in crypto in the money and banks & protocols layers of the skill cube. Nice work digging in!
👉Send us a tip for today’s issue (rsa.eth)
Not financial or tax advice. This newsletter is strictly educational and is not investment advice or a solicitation to buy or sell any assets or to make any financial decisions. This newsletter is not tax advice. Talk to your accountant. Do your own research.
Disclosure. From time-to-time I may add links in this newsletter to products I use. I may receive commission if you make a purchase through one of these links. I’ll always disclose when this is the case.