How to value crypto capital assets
Dear Crypto Natives,
If there’s a better analysis on DeFi protocols I haven’t seen it.
Lucas brings the 🔥 today.
Don’t buy LEND, KNC, SNX, MKR, ZRX—none of it—before understanding this post.
I’m serious.
If you’re making DeFi bets—the banks bets—then you need to understand how to value DeFi tokens on fundementals not pumpamentals. (Or are you trader—you gotta choose!)
And I love how Lucas ends this one.
We’re slowly starting to understand crypto assets.
That’s exactly right.
If you’re following the program you’re starting to understand crypto capital assets.
That means you’re understanding DeFi tokens before 99% of VCs, before 99.9% of Wall Street, and before 99.999% of the general population.
This is the birth of a new asset class and you’re front-running the opportunity.
Is there anything better?
- RSA
Annualized earnings are beginning to serve as one of the most effective metrics for valuing DeFi protocols.
The birth of crypto capital assets & on-chain cash flows
The advent of on-chain cash flows has birthed a new asset class, the crypto capital asset. What’s great about crypto capital assets is that we don’t have to wait for a company to report earnings once every quarter. Instead, it’s always readily available, updated every ~15 seconds.
By having a transparent mechanism for calculating a protocol’s earnings, we can apply one of the age old metrics for valuing capital assets in traditional finance—the PE Ratio. Simply put, the PE Ratio is a way to understand how the market is valuing an asset relative to the amount of revenues it generates. (Some tokens are even worth buying!)
As an example, Apple stock ($AAPL) has a PE ratio of 23.75. This means that investors are willing to pay $23.75 dollars for every $1 dollar earned by the company today. Assets with a high PE ratio generally mean that the asset is either (1) overvalued or (2) has high growth expectation. The opposite is true as well. If an asset has a low PE ratio, it means that the market believes the asset is either (1) undervalued or (2) has low future growth expectations.
In DeFi, we can take this exact same framework to see how tokenized protocols are valued relative to their peers.
While aggregating data for on-chain cash flows from major DeFi protocols seems like a tough feat, luckily our friends over at Token Terminal have done a fantastic job at providing accessible data on the state of DeFi earnings today.
Meet the Money Protocols
Below is a quick synopsis on the DeFi protocols included in this article and their respective earnings mechanisms.
- 0x - Liquidity protocol - Market fees are distributed to ZRX tokenholders/liquidity providers.
- Aave - Money markets protocol - A portion of the interest accrued is distributed to LEND tokenholders via burns.
- Augur - Derivatives protocol - Fees from prediction markets are distributed to REP tokenholders for participation.
- Bancor - Liquidity protocol - A portion of trading fees are distributed to BNT liquidity providers.
- Compound -Money markets protocol - Accrued interest is distributed to an insurance reserve.
- dYdX* - Liquidity protocol for margin trading - Trading fees are distributed to the parent company.
- Kyber - Liquidity protocol - A portion of trading fees are distributed to KNC tokenholders via token burns or dividends for governance participation (Katalyst Upgrade).
- Maker - Stability protocol - Interest accrued on the outstanding Dai is distributed to MKR holders in the form of token burns.
- Nexus Mutual - Derivatives protocol - Premiums earned from selling covers
- Synthetix - Derivatives protocol - Trading fees are distributed to SNX stakers for minting Synths.
- Uniswap* - Liquidity protocol- Trading fees are distributed to Uniswap liquidity providers.
*untokenized protocol or non-publicly accessible asset
🎙️Need an overview of the top three money protocols? Check out our three part podcast series covering Maker, Compound, and Uniswap. 🔥
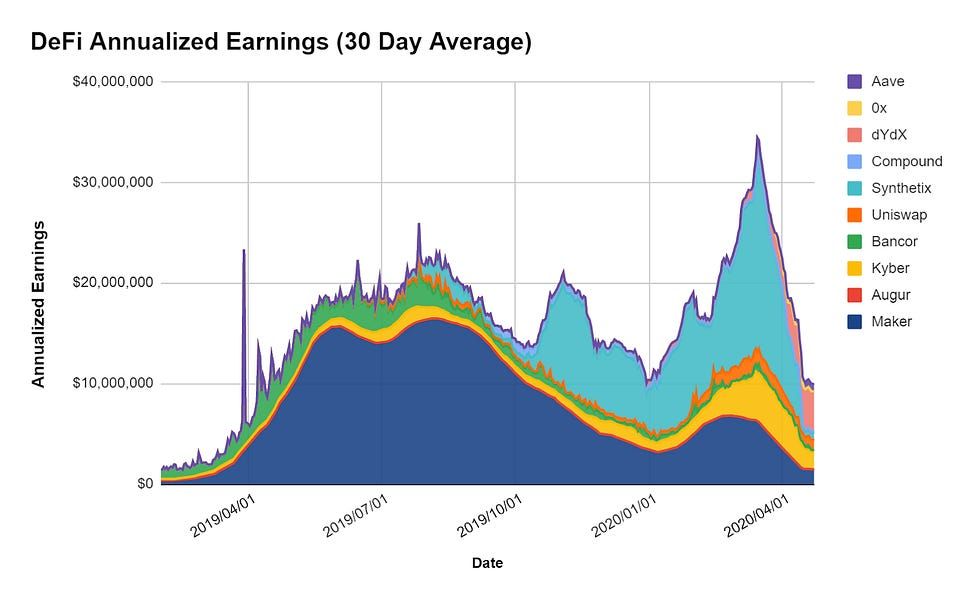
Analysis of Annualized DeFi Earnings

(Above) Average 30 Day Annualized Earnings as calculated by Token Terminal
Maker (MKR) protocol earnings
In 2019, Maker was the clear dominant force in terms of annualized earnings. The design simplicity in Single Collateral Dai (known as Sai) allowed the protocol to generate substantial earnings—even by today’s standard. In single collateral Dai, the protocol allocated all of the interest accrued from outstanding Dai for MKR burns - effectively providing MKR holders with significant cash flows in the first year of the protocol going live.
However, the introduction of Multi-Collateral Dai brought in a new dynamic. Instead of distributing the entirety of protocol earnings to MKR holders, the majority of it is now distributed to Dai holders in the form of the Dai Savings Rate (DSR). With that, the spread between the DSR and the Stability Fee is effectively the protocol’s “net profits”.
While Maker’s profits margins slimmed with its upgrade, the worst was yet to come. In response to Black Thursday in March 2020, all stability fees for supported assets (ETH, BAT, USDC) dropped to 0%. As a result, the Maker Protocol’s forecasted annualized earnings are at the lowest they’ve been since inception.
Synthetix (SNX) protocol earnings
While Maker dominated the past, Synthetix rose to prominence in the second half of 2019. The derivatives protocol was leading the DeFi sector in terms of annualized earnings, however, it was quickly revealed to be due to issues with front-running.
In the case of Synthetix, front-runners manipulated the price of an asset on the spot market and then traded it on sX before the oracle updated the price, effectively creating significant arbitrage opportunities at the cost of SNX stakers. Ultimately, the front-running attacks plagued the Synthetix network creating a disproportionate amount of earnings for the derivatives protocol. Fortunately, the front-running issues have largely been subdued and Synthetix back on track for reporting accurate earnings.
Kyber (KNC) protocol earnings
With Maker and Synthetix now showing marginal earnings, dYdX and Kyber Network currently lead the pack in DeFi.
Kyber Network’s on-chain liquidity protocol has quickly grown to prominence in the DeFi ecosystem. In March alone, Kyber reached nearly $200M in monthly USD volume across roughly ~13K unique addresses. As such, the protocol’s volumes have translated into substantial earnings for KNC token holders—roughly $2.89M in annualized earnings based on April’s volumes.

(Above) Forecasted Annualized Earnings in April TokenTerminal
While the graph above depicts Synthetix as the leader in earnings, this is largely skewed as the protocol was continuing to fix the front-running issues until about halfway through the month.
In the first 15 days of April, annualized earnings for Synthetix averaged around $6M for the year. The second half of April forecasted roughly $640k in earnings - an order of magnitude lower than the first half of the month. While the decrease in earnings may seem like a negative, it seems that Synthetix has fixed the issues and is now reporting more accurate usage and earnings.
dYdX protocol earnings
The second highest earner in April was dYdX—the DEX for margin trading and derivatives. With dYdX users can margin trade, borrow, and lend a range of supported assets. The team also recently announced BTC perpetual contracts, a derivatives product allowing users to go long and short in perpetuity.
What’s interesting about dYdX is that while they maintain and have built a product on top of the protocol, the “DEX” fees accrue to the underlying company and not a decentralized ecosystem of tokenholders. Therefore, while dYdX operates a non-custodial exchange powered by its users, the revenues from trading fees directed towards the parent company actually brings dYdX closer to a CEX rather than a DeFi protocol.
Uniswap protocol earnings
On the note of DEXs, Uniswap is one of the last major contributors to DeFi earnings. The permissionless liquidity protocol was on track to generate roughly $1M in earnings as of April. While it’s taken a downturn since its peak of $1.75M in early March, Uniswap is still up 110% in projected earnings YTD.

(Above) Percentage of total earnings in DeFi. Data via TokenTerminal.
In the last Bankless PE Ratio article, we ran a quick thought experiment on “what if” Uniswap had a native token. While this seemed like a pipedream at the time, the Uniswap V2 announcement in late March strongly hinted at a native governance token.
For those that missed it, Uniswap V2 will feature an optional protocol charge where the liquidity provider fee can shift from 0.30% down to 0.25% with the remaining 0.05% directed to a treasury where allocations will be determined via a decentralized governance process.
The rise of governance tokens fits perfectly with a Uniswap native token in the coming future. Not only would it provide previous Uniswap investors with an exit, but it would also enable a long-term sustainable model for growing the protocol. That said, the article does not outright state there will be a UNI governance token and it’s not impossible for the protocol to be governed entirely by LPs and their liquidity pool tokens.
Aave protocol earnings
The last notable earner in the DeFi sector is one of the newer money market protocols on the block—Aave.
The protocol has quickly become a fan-favorite in the DeFi community as Aave sits at #5 in terms of total value locked with $42M in value, according to DeFi Pulse. In April alone, the lending protocol has increased its project annualized earnings from $314K to $746K, resulting in a 137% increase in less than 30 days.
Analysis of DeFi PE Ratios
Now that we have an understanding on how certain protocols stack up in terms of earnings, it’s time to apply it towards the tokenized protocol and see how these protocols are valued relative to the cash they generate. (Note: Compound, dYdX, and Uniswap are all tokenless as of today and are not included in the below graphic)

(Above) Lower indicates less cost to purchase the asset per unit of profit. Data as of 05/01/20.
If you remembered our last post, you may recall the fact that 0x and Augur had insanely high PE ratios relative to the rest of the field. This continues to hold true as they currently boast ratios of 6,935 and 16,761, respectively. These numbers are largely unseen in traditional finance and likely indicate that investors have extremely high growth expectations for the liquidity and derivatives protocols.
On the other side of the spectrum, Bancor, Aave, and Kyber currently have the lowest PE ratios in the DeFi sector. While Bancor has gone largely unnoticed, the liquidity protocol is averaging roughly $327K in projected earnings at a market cap of $13.6M (which is the lowest valuation in the field).
The second lowest in terms of PE ratio is Aave, boasting a PE ratio of 74. Lastly, Kyber’s PE ratio has increased a fair amount since we last reported it, holding a ratio of 80.
For reference, in traditional finance, a PE ratio of between 50—100 is rather normal for many high-growth tech stocks. As an example, Netflix currently has a PE ratio of 86. Therefore, with a handful of these DeFi protocols having PE Ratios of less than 100, it may indicate relatively fair value based on earnings and also could mean a good buy for prospective investors.
DeFi Token Performance
Looking at token performance year-to-date (YTD), the DeFi tokens included in our analysis are up +43% on average. The two clear winners are Aave ($LEND) and Kyber ($KNC). Kyber Network’s fundamental growth in volumes and earnings along with the upcoming Katalyst upgrade has driven a bullish case for KNC tokens this year. Since January, KNC tokens have increased 213% in USD as of writing.
This is followed by Aave, which since its rebranding in January from EthLend, has performed rather well with the price of LEND tokens increasing 135% YTD. Aave’s rise in token price can largely be attributed to it’s parallel rise to prominence in the DeFi sector. The money markets protocol has seen substantial growth, reaching nearly $50M in value locked within a few short months.
On the flip side, the worst performers in 2020 have been Maker ($MKR) and Synthetix ($SNX) who have taken a hit in their valuations of -22.41% and -36.56%, respectively.
Maker’s native governance token was actually performing fairly well prior to Black Thursday as the tokens peaked at a +47.61% increase YTD by late February. However, the asset ultimately tumbled following the severe volatility from Black Thursday and the resulting Debt Auction which diluted MKR holders significantly. While the volatility from the global pandemic hit the Maker ecosystem hard, MKR has slowly recovered, increasing roughly +74% since its bottom of $200 in late March.

(Above) Performance for major DeFi tokens, data via TokenTerminal
In terms of Synthetix, the correction is likely due to the fix in front-running issues and a more accurate depiction of the protocol’s earnings. As a result, SNX tokens have fallen a fair amount since its peak in late 2019.
While Aave and Kyber were the winners and Maker and Synthetix were the losers, the two DeFi protocol’s with astronomical PE ratios—0x and Augur—remained steady. Augur’s REP tokens performed positively, increasing 16.64% YTD while 0x’s ZRX tokens have performed similarly increasing almost 10% YTD.
Tying this all together
With an understanding of protocol earnings and the price performance of the underlying tokens, we can now look to see if there’s a correlation between the two by plotting the difference in price change in the token with the change in the protocol’s annualized earnings.
Hint: There is.
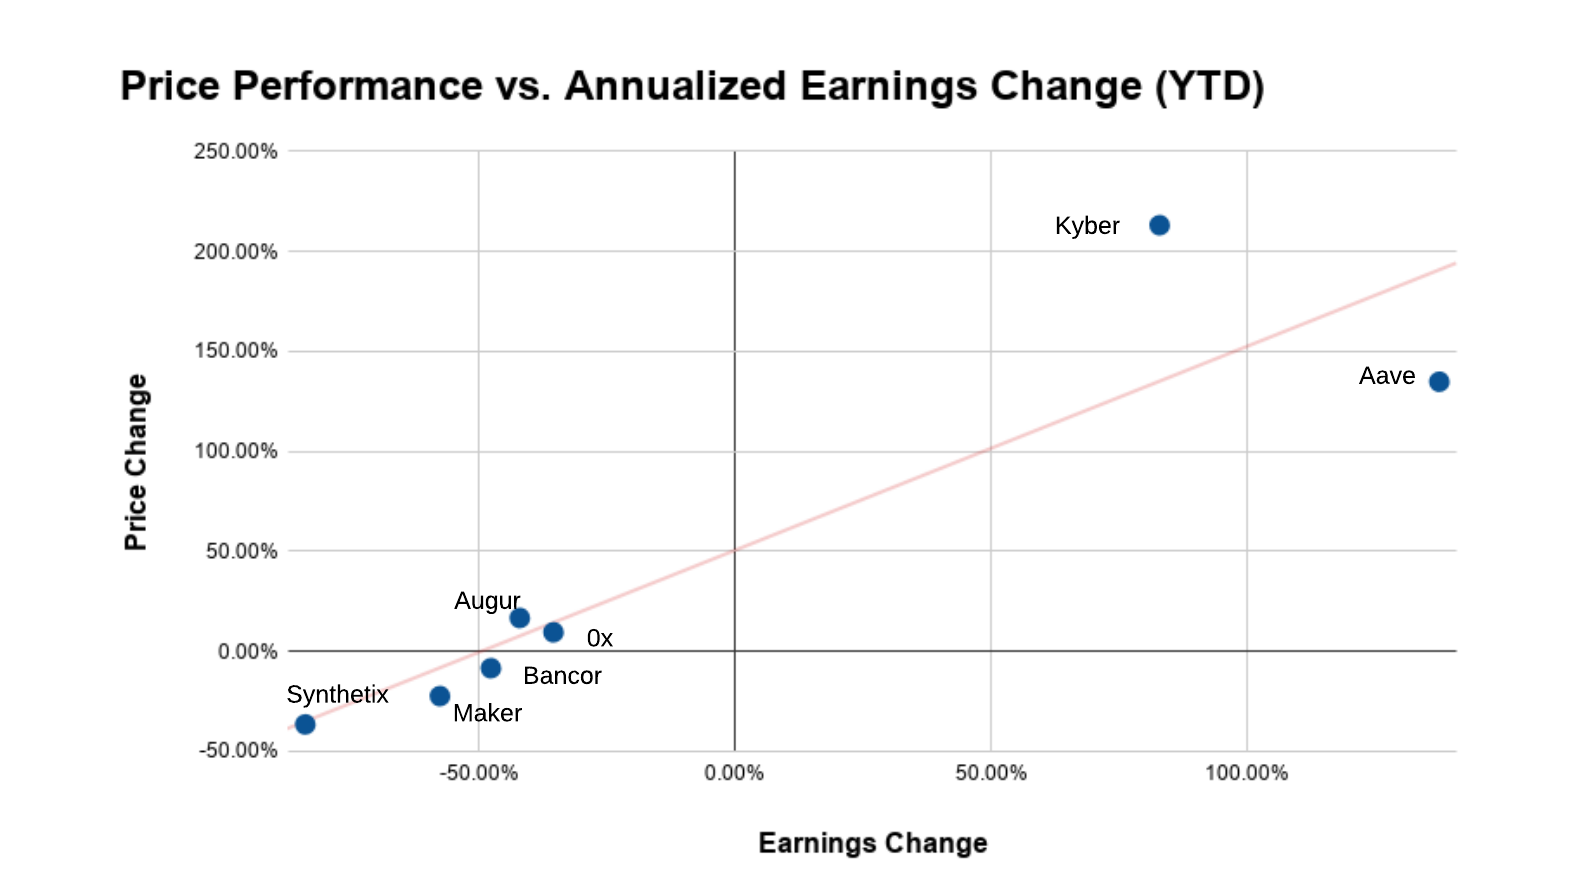
(Above) How DeFi Tokens have performed relative to change in protocol earnings via Token Terminal
The increase in annualized earnings for Kyber and Aave seems to have translated to a positive trend in the token performance.
However, we can’t determine with 100% confidence whether or not the token price drives earnings or earnings drives the token price. Intuitively speaking, when protocol usage increases, earnings should increase, which means the underlying tokens are more valuable to prospective investors assuming proper value accrual mechanisms.
The opposite could be true as well. Crypto assets are a highly nascent and immature asset class with largely inefficient markets. Thus many crypto assets valuations are driven by speculation. As such, it’s entirely possible for the protocol to increase in value based on investor speculation, which results in more users flooding into the ecosystem, resulting in more usage of the protocol and in turn, higher earnings. While this seems unlikely (and I hope it’s not the case), we’re living in the wild west filled with unknowns.
While causation can’t be guaranteed, it’s apparent that there’s a clear correlation between earnings and token price. We’ll continue to explore this relationship in later articles.
Conclusion
We’re slowly starting to understand crypto assets.
The combination of transparent, on-chain cash flows with tokenized protocols creates a new asset—the crypto capital asset. The emerging attributes of this new asset class allows us to apply familiar valuation frameworks ubiquitous in traditional finance.
Many of these DeFi tokens allow holders to capture a slice of the cash flows from value-added participation in the ecosystem.
Whether it’s through governance participation, becoming a liquidity provider, or simply just holding the token, having DeFi tokens represent economic rights to protocol earnings allows us to look at these assets in the framework of traditional capital assets.
While there’s nearly a billion of value locked in DeFi, the sector at large is still showing marginal earnings. In total, Ethereum’s money protocols are generating less than $10M in combined annualized revenues—a microscopic amount even in the broader crypto ecosystem.
However, the road to becoming bankless isn’t complete with a mere billion dollars in value locked. It’s hundreds of billions, maybe trillions.
There’s a long road ahead of us for the proliferation of new crypto capital assets and open finance at large. While we’ve learned a lot on our journey so far, there’s still plenty of unknowns to discover!
Action steps
Make sure you know how to value DeFi capital assets based on future cash flows! That’s how we value them in the Bankless program.
Look at these additional resources:
Article: Are DeFi Tokens work buying?
Data: TokenTerminal
Data: DeFiMarketCap (they’re doing a Bankless giveaway btw!)