Dear Bankless Nation,
I’m feeling like DeFi assets are undervalued lately. If that’s true now is a great time to swoop in and find the undervalued gems. So today’s article is timely.
In August, we published an article on how to value DeFi tokens like a venture capitalist.
The article leveraged growth projections to build a valuation for a protocol’s native token based on a multiple of its revenue or EBITDA—in our case, it was for MakerDAO’s MKR.
We’ve been preaching this for a while. You can value DeFi protocols the same way you value traditional companies. They have value flows. They’re the same as growth-stage startups.
Today we take this framework even further.
Evan Fisher is a founding partner at Portal Ventures and a former investor at Insight Partners, a $50B venture fund.
He uses his expertise to evaluate Curve’s CRV using two other frameworks from Wall Street: Total Addressable Market (TAM) and comparable companies.
And the numbers can get pretty insane.
Is Curve undervalued?
Read on to find out.
- RSA
Guest Writer: Evan Fisher is a founding partner at Portal Ventures, a global early-stage crypto fund focused on bringing principles of Web2 and Wall Street to help scale projects across crypto. Prior to Portal, Evan was an investor at Insight Partners ($50B AUM multi-stage VC) where he led Series A to pre-IPO investments into high-growth businesses across crypto, FinTech, internet, software, and emerging markets. He also spent two years at Goldman Sachs advising Fortune 500 companies on M&A, IPOs, debt issuances, and SPACs.
Curve: A Case Study on Investing Like a VC
Applying frameworks from Wall Street and VC to investing in crypto
Institutional investors have structured processes for analyzing investment opportunities. In my last post, we created an investment case for MakerDAO by dissecting the revenue model, analyzing the drivers of growth, and ultimately constructing a forecast model. This was a glimpse into the process to create an investment pitch.
In this post, we’ll dive into Curve to explore two additional frameworks that help guide institutional investors: TAM and comparable companies.
Whether you’re managing a personal portfolio, running a fund, or looking to break into investing, these frameworks can be helpful additions to anyone’s investor toolkit.
First, what is Curve?
With over $20B in total value locked and $120B in run-rate trading volume, Curve is one of the most important infrastructure projects in DeFi.
I’ll stick to the basic overview here. If interested in going deeper, check out the Curve docs.
- Curve is the leading AMM for trading stablecoins. Its architecture pulls from constant product and constant sum approaches to minimize slippage on pegged assets.
- Why does it matter? From USDC and DAI to wBTC and renBTC, Pegged assets are core to crypto. Minimizing transaction costs when switching between assets increases the velocity of money movement across DeFi.
- What can you trade on Curve? Top assets include USD pools (USDC, USDT, DAI, MIM, FEI, UST), ETH pools (ETH, stETH), and BTC pools (hBTC, wBTC, renBTC).
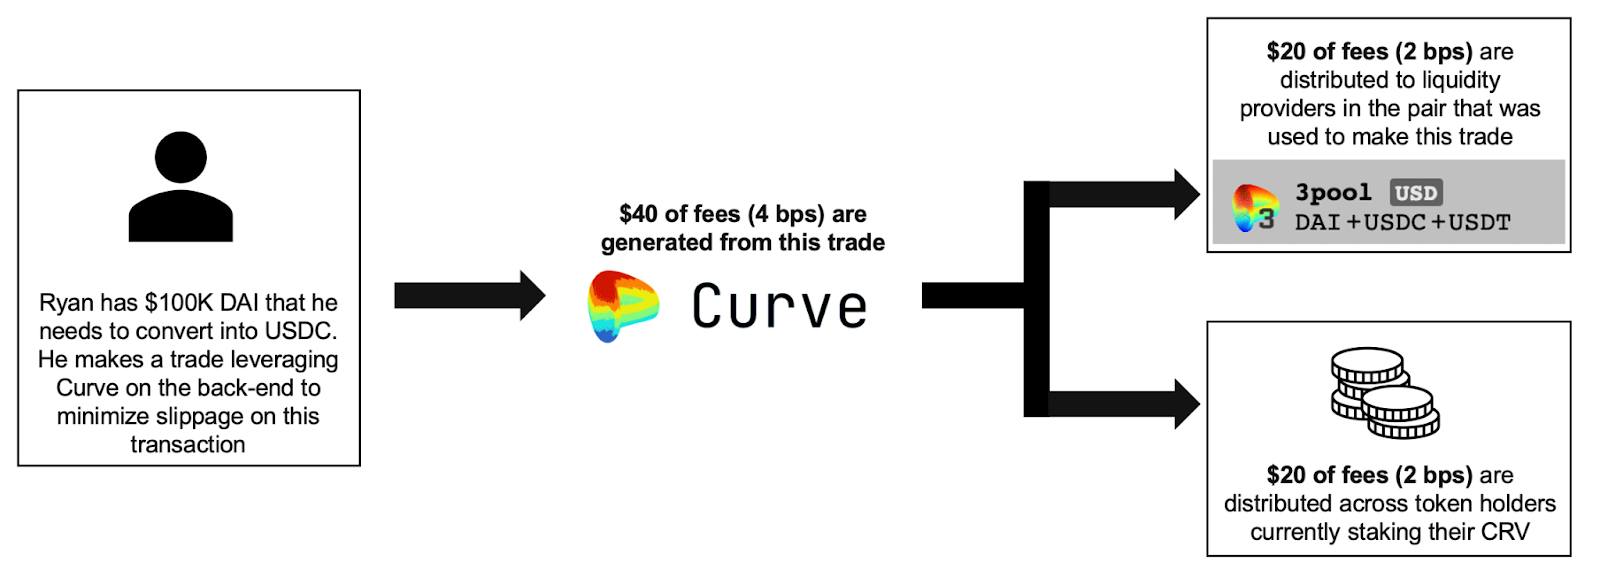
- How do Curve and its owners make money? There is a 0.04% fee (4 bps) on trades through Curve. For any trade, half of the fee goes to liquidity providers, and the other half is distributed across staked CRV tokens.

How should we think about Curve’s financials?

Before diving in too deep on any analysis, it’s important to understand the revenue model of a project (or business).
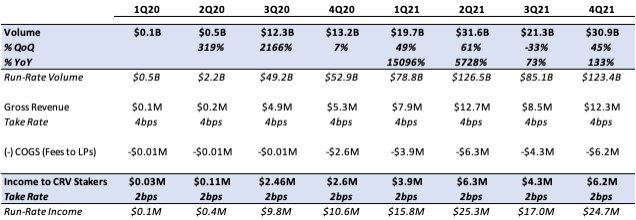
Curve’s income statement is relatively simple. The protocol processes transaction volume and collects a 4bps take rate—these fees can be thought of as gross revenue. Half of the fees are paid out to the providers of liquidity (this can be thought of as the COGS / processing fees), leaving the remaining fees as net revenue to token holders.
Although there will be additional expenses for continued development, special projects, and other community-led initiatives, they will be meaningfully smaller as a percentage of revenue than we would see for a Web2 company. Additionally, these expenses will not materially impact the cash generated for CRV token holders—which is what we’re focused on for an investment case.
For those reasons, the income to CRV stakers above is most comparable to the EBITDA / net income of a Web2 business.
This will come into play later when we think about multiples.
TAM Analysis
What is it?
The long-term revenue potential of any project or business is a function of the total addressable market (TAM). For instance, a simple TAM calculation for a company manufacturing computers would be the total number of individuals expecting to purchase a computer in a given year multiplied by the average price of a computer.
For frontier markets like crypto, the calculations are not as straightforward. It’s recommended you leverage at least two estimation frameworks (one top-down analysis and one bottoms-up analysis) to make sure your results are in the right ballpark. This process of using multiple approaches to estimate TAM is known as triangulation. It serves as a sanity check.
Let’s give it a run for Curve.
Method 1 (Top-Down): Estimating volumes as a percentage of TradFi markets
To do a top-down analysis, we’re going to look at an existing market and estimate the percentage of that market that Curve can own.
But which market is Curve most similar to?
Curve allows individuals and institutions to trade pairs of stable assets. Transactions are driven by two use cases: a) real trades, and b) arbitrage trades. In the former, users make trades because they need to swap from one currency to another to interact with DeFi projects, make payments, etc.
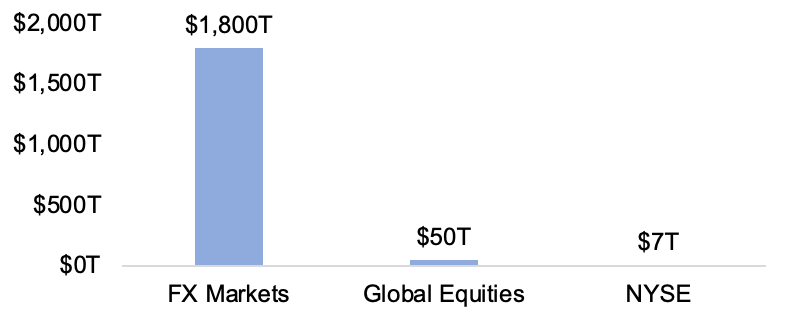
In the latter, users make trades to capture market inefficiencies / mispricing of stable assets. There is no direct analogue to this market in TradFi, but I’d argue this is closest to the FX markets.
Annual Trading Volumes Across TradFi Markets

FX markets are massive. How much of this could be converted to crypto?
The answer here is dependent on a few factors:
- What are stable tokenized assets used for in the future? Aside from DeFi, will people buy coffee with stablecoins? Will corporations fund their supply chain through stablecoins?
- To what extent will volumes be driven by retail vs. institutional traders? Over 90% of FX trading volume is driven by institutions (banks, companies, funds, etc).
- How many distinct assets will exist? As the number of tokens for any individual asset increases, so too should the transaction volumes.
Your answers to these questions will help guide you to an implied size of the stablecoin market as a percentage of FX volumes. The table below outlines market size based on several assumptions.
Annual Stablecoin Trading Volume on Exit:

Method 2 (Bottom-Up): Estimating volumes based on expected stablecoin market cap and turnover rates
To do a bottom-up analysis, we start at a more granular level and work our way up to the implied market size. We’re going to estimate the addressable volumes by forming a perspective on the expected stablecoin market cap and the asset turnover rate.
The USD stablecoin market has grown >5x the past year to over $100B in market cap today, but penetration is still under 1% of the USD money supply. Penetration rates are even lower for other currencies.
How big can the stablecoin market get? The global money supply across all currencies is >$130T, of which over 90% is already digital (i.e. not held in physical cash). The table below outlines the implied stablecoin market cap as a percentage of the global money supply.
Stablecoin Market Cap on Exit

A few questions to help guide your perspective:
- To what extent will stablecoins be regulated? How does this impact the potential use cases of stablecoins over the coming years?
- Which currencies are addressable for tokenization? China has the largest fiat market cap (~$40T) - should tokenized RMB be included in the expected stablecoin market cap?
- What non-fiat-pegged assets should be included in this market size?
After forming a view on the total stablecoin market cap, it’s time to estimate the asset turnover rate to calculate expected volumes. A few helpful data points on annual asset turnover rates across various tokens/currencies (presented in ranges given large variances):
- ETH: ~7.5-15x
- USDC: ~20-35x
- stETH: ~1x
- DAI: ~15-25x
- Global Money Supply: 10-15x
The table below pieces these two variables together to arrive at an estimate for total stablecoin trading volume.
Annual Stablecoin Trading Volume on Exit

Takeaways
Estimating future trading volumes in a frontier market is really (really!) challenging.
From these two analyses, we can begin to contextualize the story you need to believe in order to underwrite various TAMs and volume forecasts. For example, if you think TAM is $40T and Curve will do $10T of volume, you would have to believe something along the below. Sense check your assumption, do they feel realistic?
- Total stablecoin trading volumes are ~2% of the total FX market volumes.
- Total market cap of stablecoins is $3T (~2.5% of the global money supply) and assets are traded on average a little over 10x each year.
- Curve processes ~25% of total stablecoin trading volumes.
Comparable Companies
What is it?
Investors look to comps to approximate the multiple at which they expect a business to trade over the long-term. The best companies for a peer set operate in a similar vertical with a comparable business model/profitability profile.
Selecting the Comps
The best peers for Curve are exchanges. I’ve selected three comparable companies below.

Several companies (Galaxy Digital), categories (Banks), and protocols (Uniswap/Sushiswap) have been purposefully excluded because either a) their revenue lines are too diversified, or b) their monetization models are too different.
Analyzing the Peer Set
Now that we’ve outlined the peer set, how do we use this information?
Step 1: Determine the best type of multiple
We can choose between either revenue or EBITDA multiples. EBITDA (Earnings Before Interest, Tax, and Depreciation & Amortization) is a metric to approximate the cash flow of traditional businesses.
Here, I’d recommend we look to EBITDA multiples to better take into account the margins of each business. If these businesses were loss-making or not yet at long-term margins then we would have focused on revenue multiples instead.
Step 2: Analyze the data
Start by calculating the mean and median. Understand which companies are trading above/below this and why. My quick read of the data is as follows:
- Mean / Median: 17.7x
- Curve: Trading well above the peer set, which implies investors expect either a) disproportionate growth over the coming years, b) supply shocks to drive price from stock-to-flow, or c) some additional, non-cash flow utility of the token (i.e. governance, LP boosts, compensation for voting bribes)
- Intercontinental Exchange/Nasdaq: Both are trading in a relatively tight band on EBITDA multiples. Growth, profitability, and end markets are very similar.
- Coinbase: Despite nearly 5x YoY growth, public market investors have concerns around the volatility of trading volumes and sustainability of take rates. Coinbase trades at about the same multiple as the two traditional exchanges.
Step 3: Forming a view
Unless there is strong reason to believe otherwise, as markets become more efficient and Curve hits higher penetration rates on total TAM (resulting in slower growth) it should trade at an EBITDA multiple in the high-teens.
Here are some questions to evaluate if Curve will trade as a structurally different profile:
- What percentage of market share will Curve command? If this is >50% there may be a scarcity premium placed on the asset.
- Will Curve have additional revenue lines outside of its spot trading product?
- What other financial or non-financial benefits will holders of CRV have? How material will these be?
- How does the liquidity of CRV change with projects like Convex?
Once you’ve formed your view on the expected multiple for Curve, you can combine this with your volume estimate to calculate the implied market cap and price per share.
Here’s a table with potential outcomes:
Market Cap Sensitivity

Share Price Sensitivity

🧠 This is a broad estimation using our framework! It’s up to you as an investor to make more precise assumptions to get your expected valuation :)
CRV is currently trading at $3.7.
At $5 trillion in volume and a multiple of 15x, the implied price of CRV would be $4.95.
Check out the table above for CRV’s implied price at different volume and multiple estimates!
Concluding Thoughts
Today’s crypto markets are volatile.
They move on narratives, news, and stock-to-flow. That said, over time, these markets will become more efficient. Additional institutional capital will enter the space with longer-term hold horizons. We’ll see downturns that push investors towards more economically generative assets.
Estimating the long-term fundamental value of a project will become increasingly important. This is a glimpse into the frameworks institutional investors use to do just that, and you can start incorporating them into your portfolio strategy today.
Action steps
- Evaluate CRV based on your own assumptions
- Read How to invest in DeFi like a VC (Part I)
