Why ETH will hit $20K

Dear Bankless Nation,
Price predictions are always hard—especially when you factor in that token economics is an emerging field of study.
But with basic economic principles like supply and demand, we can build frameworks to value crypto asset classes.
Proof of Stake falls neatly into a supply and demand model.
With a 90% reduction in ETH supply, what happens to ETH price?
Nilo Dos Santos Orlandi presents his thesis in a comprehensive paper, equating the PoS issuance drop-off to Bitcoin’s four-year halving cycles.
His conclusion?
ETH is going to $20,000. 🚀
- RSA
P.S. Bankless DAO’s season 2 launch event is tomorrow. You really don’t want to miss it.
Guest Writer: Nilo Orlandi is the founder at Bubbly-Gurgle, a media studio generating meaningful content on the ongoing financial, social, and artistic revolution.
When you look at current prices and you take into account the efficiency gains of removing proof-of-work after the merge, we’re looking at 13 billion dollars per year…of buy pressure relative to what we have today. - Justin Drake, Bankless Episode #57 - Ultra Sound Money
Token economics is a growing field of study that ties the programmatic emission of tokens with incentives to drive economic outcomes. It’s nascent and confusing. There are multiple ways to value a token, just like there are multiple ways to value equities (DCF, DDM, comparables).
Other factors will certainly matter like regulation, network usage, EIP-1559, but if all else were equal, we could oversimplify why Ethereum will be valued at $20,000 after proof-of-stake to just one reason: Issuance.
Issuance is the number of new coins that are created every day in a crypto network. However, it’s not necessary to understand why issuance exists to understand why Ethereum is grossly undervalued: simply take note that issuance is a necessary aspect of all cryptocurrencies and is associated with the cost of securing a crypto network.
To keep things simple, the cost of keeping a crypto asset’s price stable is equal to the number of coins issued per day multiplied by the price per coin.
Let’s take Bitcoin, for example. In the case of Bitcoin, 900 new bitcoins are created every day. If each bitcoin is valued at $45,000 then the cost of keeping Bitcoin’s price stable is at around $40.5 million per day. By “stable” I mean that there must be $40.5 million in new demand to offset the increased supply from daily issuance.
Ethereum also has issuance, around 13,500 ETH are issued every day. At a price of an average of $2,000 per ether in 2021, it currently costs around $27 million per day to keep Ethereum’s price from dropping.
The big change that is about to happen is that Ethereum will undergo an upgrade that will reduce its issuance by 90%. I am referring to Ethereum’s full transition to proof-of-stake. Again, you don’t really need to understand what proof-of-stake is to follow my argument, just understand that it will reduce the number of new ETH created every day.
This article predicts a fair long-term price of ether at $20,000 after the merge. The first part of my argument is very easy to understand: just simple algebra.
The Algebra of Issuance Reduction
Today our daily issuance is:
13,500 ether x $2,000 per ether = $27 million
This means that the cost of keeping the price of ether from going below $2,000 is $27 million per day. After the transition to proof of stake, we will have a reduction of 90% in issuance, bringing it down to around 1,350 new ether created per day:
1,350 ether x $20,000 per ether = $27 million
In other words, if the market continues to pump $27 million per day into ETH (as it has been doing throughout 2021) after proof-of-stake, the price of ether must increase to $20,000 per coin.
How quickly will this happen?
The rest of this article answers this question using a method called the inelastic market hypothesis. This hypothesis, developed by professors Xavier Gabaix & Ralph S. J. Koijen, puts forth the idea that markets respond inelastically to investors’ flows.
Using Bitcoin’s past halving cycles, I measured the inelasticity of the Bitcoin market and extrapolated it to Ethereum. The inelasticity factor found for Bitcoin was 20, which means that every dollar invested in Bitcoin makes the market cap increase by 20 dollars. Using this inelasticity factor, I predicted that, after proof-of-stake, Ethereum’s price should increase at an average rate of 8% per month due to the reduction of issuance alone.
Inelastic Market Hypothesis: A Brief Background
Two months ago, an interesting piece began circulating in Crypto Twitter from Xavier Gabaix and Ralph S.J Koijen titled “In Search of the Origins of Financial Fluctuations: The Inelastic Market Hypothesis.” The authors put forth the proposition that today’s stock market reacts inelastically to investors’ flows. Their simplest model, which includes a bond market and an equity market, indicates that selling $1 in bonds and buying $1 in equities has the effect of increasing the equity market cap anywhere from $3 to $8. Their paper goes on to demonstrate, both theoretically and empirically, why this is the case.
The main reason for the inelasticity of equity markets, according to the authors, is related to the behavior of households and institutions, who hold the majority of equities in the US (approximately 80%). Both households and institutions are illiquid market participants, meaning that they buy equities and hold them for extended periods of time, regardless of price fluctuations. Why?
In the case of institutions, they often have mandates which force them to keep a part of their holdings in equities. Households that do not actively trade the stock market often prefer a “buy and hold” strategy. This lack of liquidity in the equities market causes volatility, and this volatility can be quantified and explained by the inelastic market hypothesis. The inelasticity factor given by their study is 3-8, which means that for every dollar invested in equities, the market cap may increase from 3 to 8 dollars.
This general behavior of households and institutions in the equity market reminded me of the HODL culture of the Bitcoin community, who pride themselves in holding their bitcoins regardless of price fluctuations. If volatility is so closely related to illiquidity, and if the inelasticity of equity markets is 3-8, and knowing that this is caused by similar behavior in both markets, how much more inelastic is the crypto market if compared to the equity market?
This is the first objective of this paper, to arrive at an estimate for the inelasticity of the Bitcoin market. The method used will be analyzing Bitcoin’s past halving cycles and measuring the effect that the supply shock from each halving had in accelerating the price increase of Bitcoin after the halving date.
The second objective of this paper is to predict how Ethereum’s EIP-1559 and the transition to proof-of-stake will affect its price. This will be done by estimating the magnitude of the supply shock of each of these two events and factoring in the inelasticity factor found in the Bitcoin market.
The Bitcoin Halving: A General Framework
Let’s understand how issuance works for Bitcoin:
- New bitcoins are created and sold on the market every day.
- The number of newly created bitcoins is abruptly reduced by half every four years. This event is called the halving.
Let’s put our first point in context. If new bitcoins are created and put on the market every day, the overall supply of bitcoin increases every day. As you can imagine, if nobody were there to take these newly issued bitcoins off the market, the price of Bitcoin would tend to go down. This is easy to understand: if there is too much of something, it becomes cheaper. Hopefully, at some point, the price of this asset becomes cheap enough that people choose to buy an amount equal to what is being created, keeping the price stable.
Let’s say that we have arrived at this stable price, at which the newly issued bitcoins are bought by a group of investors.
If Bitcoin’s price remains the same for an extended period of time, this indicates that there is a constant demand for bitcoins. Otherwise, if there weren’t investors willing to buy the newly issued bitcoins, the price of Bitcoin would trend towards zero, as mentioned before.
💡 If the price of Bitcoin is stable or increasing over time, the newly issued bitcoins are being bought off the market.
A Closer Look at Supply Shocks
So let’s think about the Bitcoin market right before the halving event. Come the day of the halving and, as expected, the issuance of bitcoins is reduced by half. If we assume that demand remains the same as it had been before, then this will force the price to go up over time because of the ensuing supply shock.
For our paper, the supply shock will be the reduction in the number of bitcoins issued after the halving date. In other words, the supply shock equals the number of coins that would have been issued if the halving had not happened.
My argument is that the supply shock multiplied by the average value per bitcoin accrues to the value of the Bitcoin network over time. This can be represented as “value invested,” since the flow of money works as an investment of capital:
supply shock x average price per bitcoin = “value invested”
“Value invested,” which used to keep the value of Bitcoin from decreasing, now contributes to increasing the value of Bitcoin. The factor by which “value invested” increases the market cap, represented by h1, is the inelasticity:
“value invested” x inelasticity = h1
Here is a simple example to clarify these concepts. Imagine you have an office building, and that you have to pay $100 every month for the air conditioning bill because it is summer. Every month your accountant writes off $100 that goes to paying for the electric bill of the AC. When summer ends, you don’t need to pay $100 anymore because it is colder. Let’s say you end up paying $50 in AC bills now that summer is over. This means that you now have $50 dollars more to invest in your company. Now your accountant can register that you have a surplus of $50, which adds value to your business.
The difference between the example above and Bitcoin (and equity markets in general) is the concept of inelasticity, which means that those $50 of “value invested” may actually accrue, say, $200 to the value of the asset (inelasticity factor of 4, in this example). Also, the halving acts as a perpetual winter, which decreases your air conditioning bill by half, every four years.
Next let’s estimate these these variables:
- The increase in market cap due to the supply shock, h1
- “value invested”
If we have these variables, we can arrive at the inelasticity of the Bitcoin market:
h1/ “value invested” = inelasticity
This approximation of the inelasticity of the Bitcoin market can then be used to calculate the magnitude of the price change that Ethereum will undergo after EIP 1559 and the transition to proof-of-stake.
The Bitcoin Halving Cycle: A Tale of Two Curves
Let’s use the 2016-2017 market cycle as an example of how to calculate the increase in market cap, h1, due to the supply shock, and “value invested”. The same process described below was used to infer inelasticity from the 2012 and 2020 cycles.
Below is a chart of Bitcoin’s market cap beginning in January 2015, and ending around March 2018. I included some points on the graph, which represent the following dates:
- Blue: Lowest market cap since prior halving
- Yellow: Halving date
- Red: 100% increase in market cap from Halving date (or a 2x increase in the market cap relative to the market cap on the halving date)
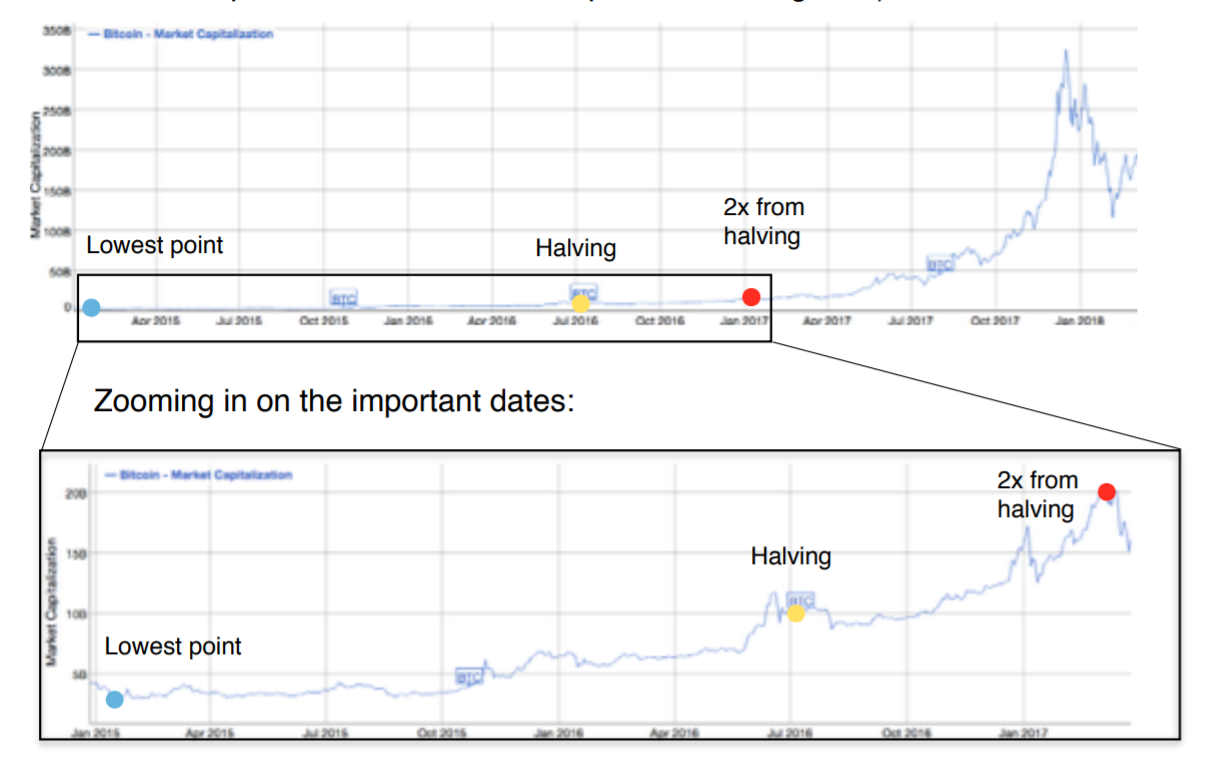
Blue, the lowest point since the prior halving, is our starting point. At this point, the price of Bitcoin has become so low that investors are happy to buy the new bitcoins that arrive on the market. The price is increasing from Blue to Yellow and then from Yellow to Red. We can be sure then, that the new bitcoins entering the market are being bought. Yellow is the halving date, the date on which Bitcoin´s issuance is reduced by half.
Since the price of Bitcoin increases steadily, as can be seen in the graph, we can express this upward trend as a slope, m1:

What does m1 represent?
The daily increase in the Bitcoin market cap prior to the halving date. For simplicity, I used a linear regression between these two points. Further research could focus on alternative regressions. So what happens around the actual date of the halving? If you take a closer look at the graph, in the vicinity of July, 2016, what happened was a typical “buy the rumor, sell the news” event.
After this noise, Bitcoin continued to go up.
The halving, it seems, was not priced in!
Bitcoin continues its upwards trend after the halving, but now at a faster rate, m2. We can represent the new rate of increase in market cap after the halving by drawing a second slope, m2, from the halving date to an arbitrary point on the graph, in this case, at 2x halving market cap.

Let’s take a step back to put all this in context with an example.
Before the halving, let’s say the price of Bitcoin was at $1,000 and that there were 50 bitcoins issued per day. If the price of Bitcoin was stable or going up over time, this means that the market was paying $50,000 a day for the newly issued bitcoins. After the halving, the market keeps paying these $50,000 per day; however, there are only 25 bitcoins being issued after the halving event.
At $1,000 per Bitcoin, what happens to those extra $25,000 dollars? They accrue to the value of the network!
This is what I chose to call “value invested.”
“Accruing to the value of the network” is just a fancy way of saying that this money will be used to buy old bitcoins, or bitcoins that were not issued that day. Inelasticity is relevant in this context because those $25,000 may actually make the market cap of Bitcoin increase by $125,000 if the inelasticity factor is 5. The next section deals with determining “value invested” and the increase in the market cap due to the halving effect, which we will call h1.
Inferring Inelasticity from the Difference Between m2 and m1, “value invested,” and h1
Let’s imagine that the halving had not occurred. In this case, we can assume that Bitcoin’s market cap would have continued to increase at the rate of m1, and would most likely be near the green point on the graph.
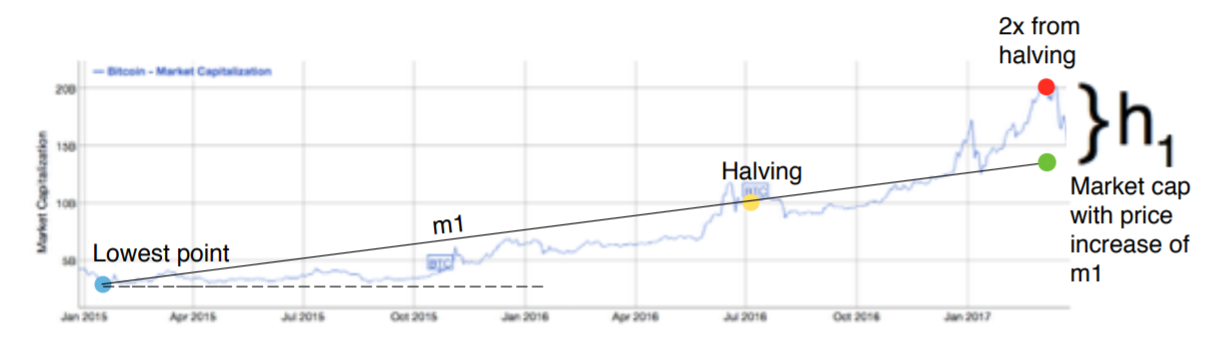
We can calculate how much of the increase in Bitcoin’s market cap after the halving was due to the halving effect. This can be done by taking the difference between the market cap at the red point and the market cap at the green point, which gives us the increase in the market cap due to the halving effect, h1.
Simple, huh?
Now comes the final step: determining “value invested;” it is equal to the number of bitcoins that would have been issued if the halving had not happened (supply shock) multiplied by the average price of these bitcoins:
supply shock x average price of bitcoins = “value invested”
Again, I call this “value invested” because this is the value that is invested in the Bitcoin network, the value that accrues to the Bitcoin network. If we divide h1 by “value invested” we arrive at a rough estimate of the 13 inelasticity of the Bitcoin market.
h1/ “value invested” = inelasticity
Results
Here are the values of inelasticity that I found for each Bitcoin cycle:
- 2012 - 24.9
- 2016 - 20.7
- 2020 - 70.2
As you may imagine, I was pleasantly surprised at how close the inelasticities of cycles 2012 and 2016 were and disappointed at how different the inelasticity of 2020 was in relation to the other two. After giving it some thought, I arrived at an explanation for this.
The Covid outbreak made markets plummet right before the halving, and the effects of quantitative easing quickly recovered these markets right after the halving, around May 2020. These two factors reduced the average price per Bitcoin before the halving and decreased the time it took for Bitcoin’s market cap to double after the halving (see Appendix B). I share the frustration of other analysts who have had only three data points on which to base their predictions. Actually, in my case, one of those data points can be considered an outlier due to the Covid outbreak.
Comparing to the Harvard paper, the inelasticity of equity markets was within a 3-8 range. We can tentatively say then that the Bitcoin market’s inelasticity is ~20, which means it is 3-7 times as inelastic as equity markets.
To put this into simple terms, every $1 used to purchase BTC results in a $20 increase in its market cap.
🧠 All the relevant data used to arrive at the results are listed in Appendix A.
Ethereum: what to expect from EIP-1559 and PoS
The next part of this paper assumes that the Ethereum market has a similar inelasticity as the Bitcoin market. Being the second-largest cryptocurrency by market cap and displaying similar volatility movements as Bitcoin, this is a fair assumption.
On-chain data indicates that people have been holding ETH in anticipation of the transition to proof-of-stake, which is further proven by the reduction of ether on exchanges. Furthermore, the day-to-day price fluctuations of these two cryptocurrencies are near identical. Therefore, we can assume that their inelasticity values are similar.
Knowing that both markets exhibit similar behaviors, we will use our baseline inelasticity of 20 to predict the price action of Ethereum after EIP 1559 and the transition to proof-of-stake. The steps I followed to calculate the monthly increase in the price of Ethereum due to its catalysts are essentially the reverse process of calculating inelasticity.
🧠 If you want to follow the process step-by-step, I included it in Appendix C.
The results: EIP 1559 should increase the price of ETH by 2% a month; the transition to proof-of-stake should increase the price of ETH by 6% a month.
This means that the combined effect of both these catalysts is an 8% increase per month. This is an average value, which assumes that everything else remains the same. Short-term fluctuations in price are impossible to predict, I am interested in the long-term.
Bringing it All Home, Where is the Price Headed?
Consider this: in 2021 so far, ether had an average price of $2,000 and an issuance of 13,500 ether per day. This means that, at $2,000 per ether, the market needs an injection of $27 million per day just to keep the price stable at $2,000. Let’s say that ether remains near this price until the transition to proof-of-stake.
daily issuance x price per ether = daily cost of keeping ether´s price stable
13,500 ether x $2,000 = $27 million
So what happens when issuance drops by 90% after the transition to proof-of-stake? Well, let’s assume that $27 million keeps pumping into Ethereum. Then, let’s put our new issuance of 1,350 ether per day. At what price could ether be sustained?
$27 million / 1,350 ether = $20,000 per ether
After the transition to proof-of-stake, ether will at least increase in price at an average rate of 8% a month, with $20,000 per ether being an acceptable price over the long term after 2022.
Many people will look at my $2,000 average price per ether with suspicion. These people could argue that using the average price of 2021 is biased since ether has seldom achieved these price levels before in its history. Perhaps it would be more realistic to use the average price of Ethereum going further back in time.
The simple rebuttal to this argument is that the number of people who have entered the Ethereum community has increased in such a way that it is almost impossible for ether to revisit the triple-digit range.
Xavier Gabaix explained this phenomenon in his paper by saying that “a permanent shift in the demand for stocks must create a permanent shift in the equilibrium price.” If I were to use the average price of Ethereum using data from 2020, I would be disregarding the NFT mania, DeFi summer, the Ultra Sound Money meme, the Triple Halving meme, and other meaningful events and ideas that lured people to Ethereum this year.
The market has been channeling $27 million per day just to keep ether’s price stable for over 8 months. From my perspective, 8 months is enough data points to defend my argument.
Some people might say: what about the ether that is being produced and held by miners? They are getting ether for a lower price than $2,000, so we cannot say that the market is necessarily paying $27 million per day to buy the new ether.
My answer: although it is true that miners produce ether at a cost lower than the market price, not selling this ether for a profit represents an opportunity cost to them. Also, since proof-of-work mining is a low-profit margin business, the cost of producing ether may not be that much lower than the actual market price.
My Speculative Predictions for What is to Come
- Ether will continue an upward trend throughout 2021. Corrections of ~30% as price moves up, reaching newer local highs. A ~50% correction will only occur in the case of a black swan event.
- After proof-of-stake, there will be a “sell the news” event, a correction no larger than ~20-30%.
- Ether is headed to a long-term price range of $20,000, the maximum price between 2022 and 2023 will likely overshoot this figure due to speculation, new market entrants, hype.
- After the bubble pops, ether will stabilize at ~$20,000 over the long term, after 2022.
- In 2024, Bitcoin will undergo its 4th halving, moving the entire market to new all-time highs
Final Thoughts
Importantly, the data are consistent with a quite long-lasting price impact of flows. Indeed, in the simplest version of the model, the price impact is perfectly long-lasting. This is not necessarily because flows release information, but instead simply because the permanent shift in the demand for stocks must create a permanent shift in their equilibrium price. -Xavier Gabaix, In Seach of the Origins of Financial Fluctuations: The Inelastic Market Hypothesis
Raoul Pal has said that he predicts $20,000 for ether this market cycle, but he believes that the transition to proof-of-stake will be a “buy the rumor, sell the news” event. I agree with him, but I do not believe that we will have a cycle top in the vicinity of the transition to proof-of-stake. If we reach $20,000 before the transition to proof-of-stake I would interpret that as hype, because the market is not sophisticated enough to price this change, and I would expect a major correction. Reaching $20,000 can happen any time, keeping the price stable at $20,000 will be a result of flows of capital entering Ethereum over an extended period of time, after proof-of-stake.
Here’s an interesting ramification of my argument: every time Bitcoin undergoes a halving its price should at least double relative to its average price before the halving. Because other factors come into play after the supply shock resulting from the halving (new market participants, hype…) its price increases much more than that.
That is why I believe that Ethereum’s all-time high this cycle will be above its long-term price of $20,000.
The new all-time highs we reach now will serve as a reference for the next cycle’s expectations. Look at the quote above. “The price impact is perfectly long-lasting… A permanent shift in the demand for stocks must create a permanent shift in their equilibrium price.” You can be sure that whatever all-time high we reach this cycle will be surpassed on the next cycle. This much is obvious to a great part of crypto enthusiasts and is probably the reason why we did not revisit lower lows after the China ban of May 2021.
One final note: the timing of this event, the transition to proof-of-stake, is not a coincidence: this will be the bridge between Bitcoin’s halvings. It will prevent a longer crypto winter and speed up the adoption of cryptocurrency. A friendly, albeit perhaps unwanted, pat on the back of bitcoiners.
We’re gonna make it.