The Ethereum Q2 2023 Report

Dear Bankless Nation,
Today, we dig into one not-so-simple question: How is Ethereum doing?
Below, we've presented a digestible deep dive into Ethereum's financial performance over Q2 2023, unpacking the metrics that matter most in judging the growth of Ethereum at the protocol-level and in its various ecosystems.
- Bankless team
How ETH performed in Q2 2023
Bankless Writer: William M. Peaster | disclosures

We’re now halfway through 2023, and Ethereum has been showing considerable resilience amid the ongoing cryptoeconomy 🐻 market compared to other alt-L1s. The below report examines top-line metrics for the second quarter of 2023 (ending June 30th) for the Ethereum network and its ecosystem as broken down into four categories:
🟦 Protocol
🟩 DeFi Ecosystem
🟥 NFT Ecosystem
🟪 Layer 2 Ecosystem
After digging into the above, we’ll then move you through our top ecosystem highlights and our forward outlook for the protocol. The full ETH Q2 2023 Report is available only to paying subscribers of Bankless. Become one!
These numbers compare Ethereum’s performance in Q2 2023 against Q2 2022.
🟦 Protocol
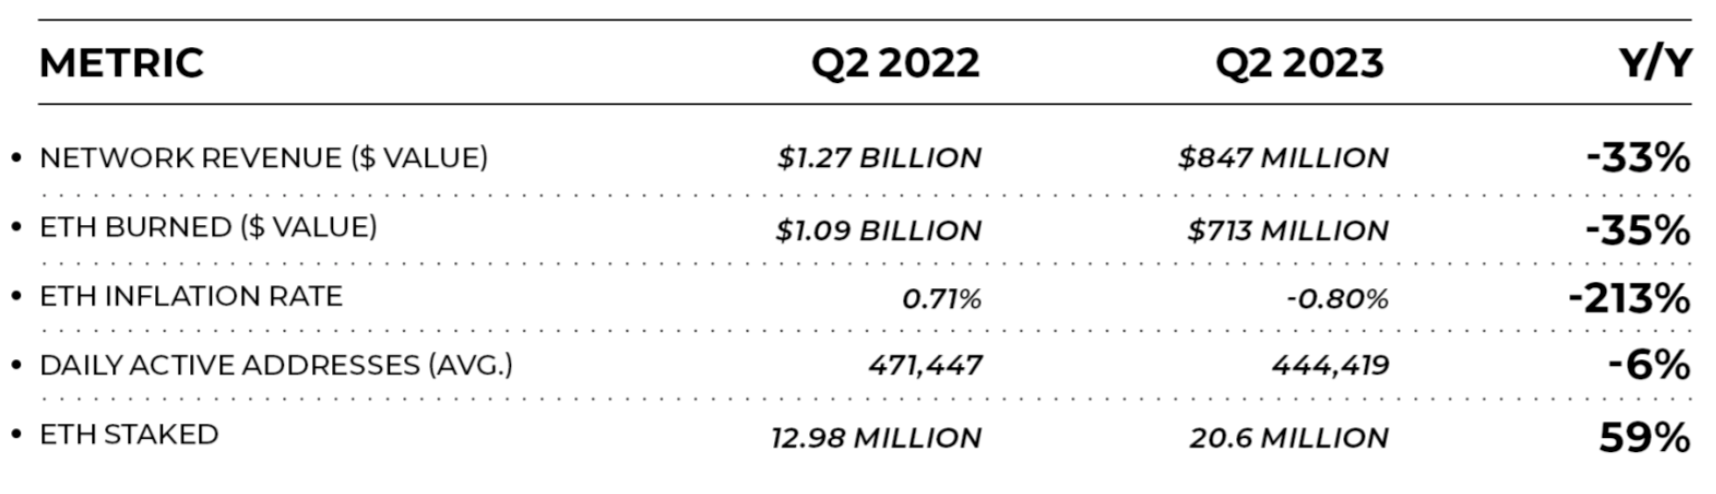
🟦 Network revenue dropped 33.3% from $1.27B to $847M. The USD value of ETH burned fell 35% from $1.09B to $713M
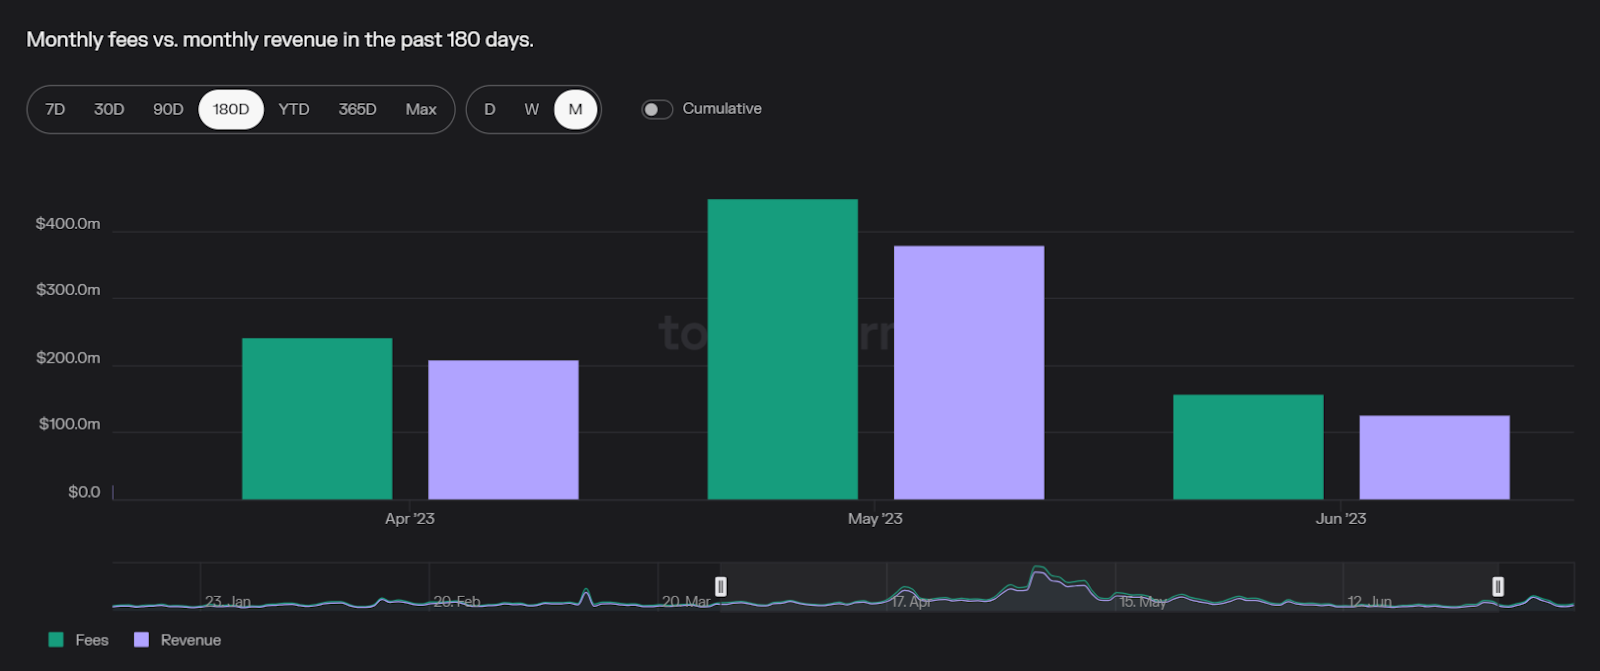
Network revenue measures the total value of transaction fees paid by users to Ethereum validators, as well as the portion of said fees that is burned (i.e. removed from the circulating supply of ETH via EIP-1559 burning).
Considering the bearish conditions we’ve seen in crypto in recent months, it’s somewhat surprising that there wasn’t a larger revenue decline year-over-year. Ethereum has held up well activity-wise in this regard. That said, the decline we’ve seen here still showcases the bearish conditions lately. As demand for blockspace has dropped, so have Ethereum’s earnings and burnings for now.
🟦 ETH Inflation Rate decreased 213% from 0.71% to -0.8% on average
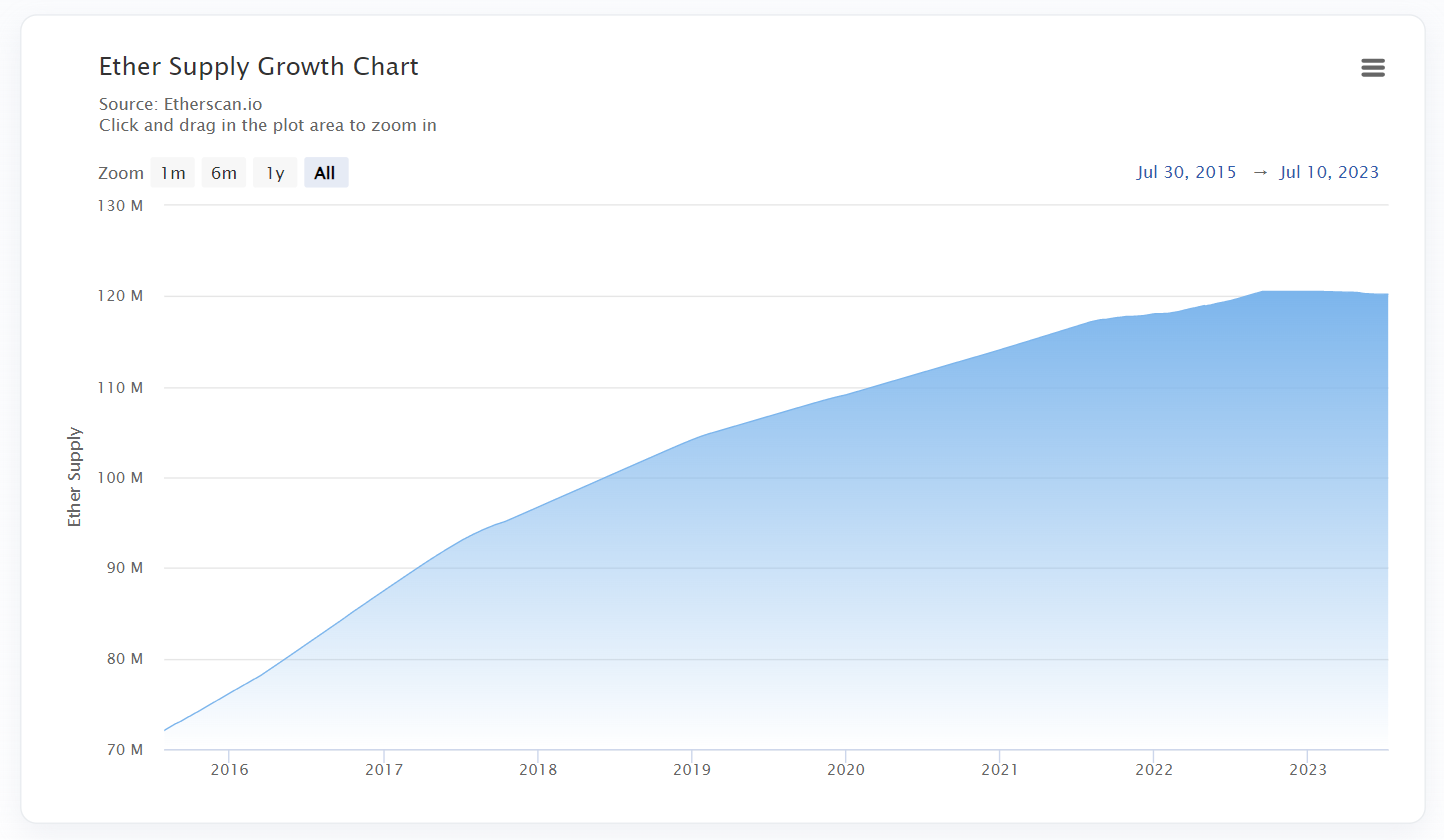
The ETH Inflation Rate tracks the growth in overall supply of ETH over the course of the quarter. This growth rate turned negative as the EIP-1559 fee burning mechanism is now chugging along at full steam ahead.
🟦 Average daily active addresses declined 6% — from 471,447 to 444,419
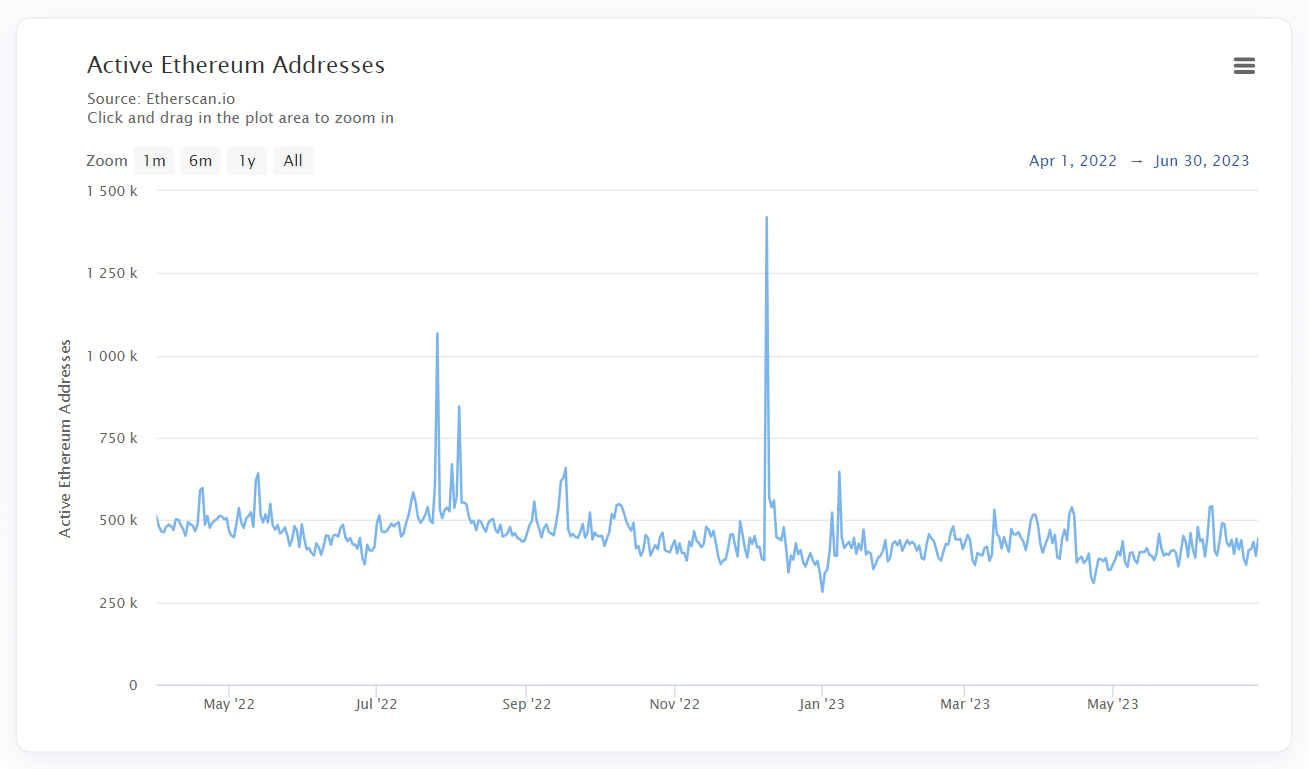
This metric tracks the average number of wallet addresses to transact on Ethereum each day over the duration of the quarter. As with network revenue, it’s fairly surprising this figure hasn’t dropped further amid the current bear market.
🟦 Staked ETH increased 59% from 12.98M to 20.6M
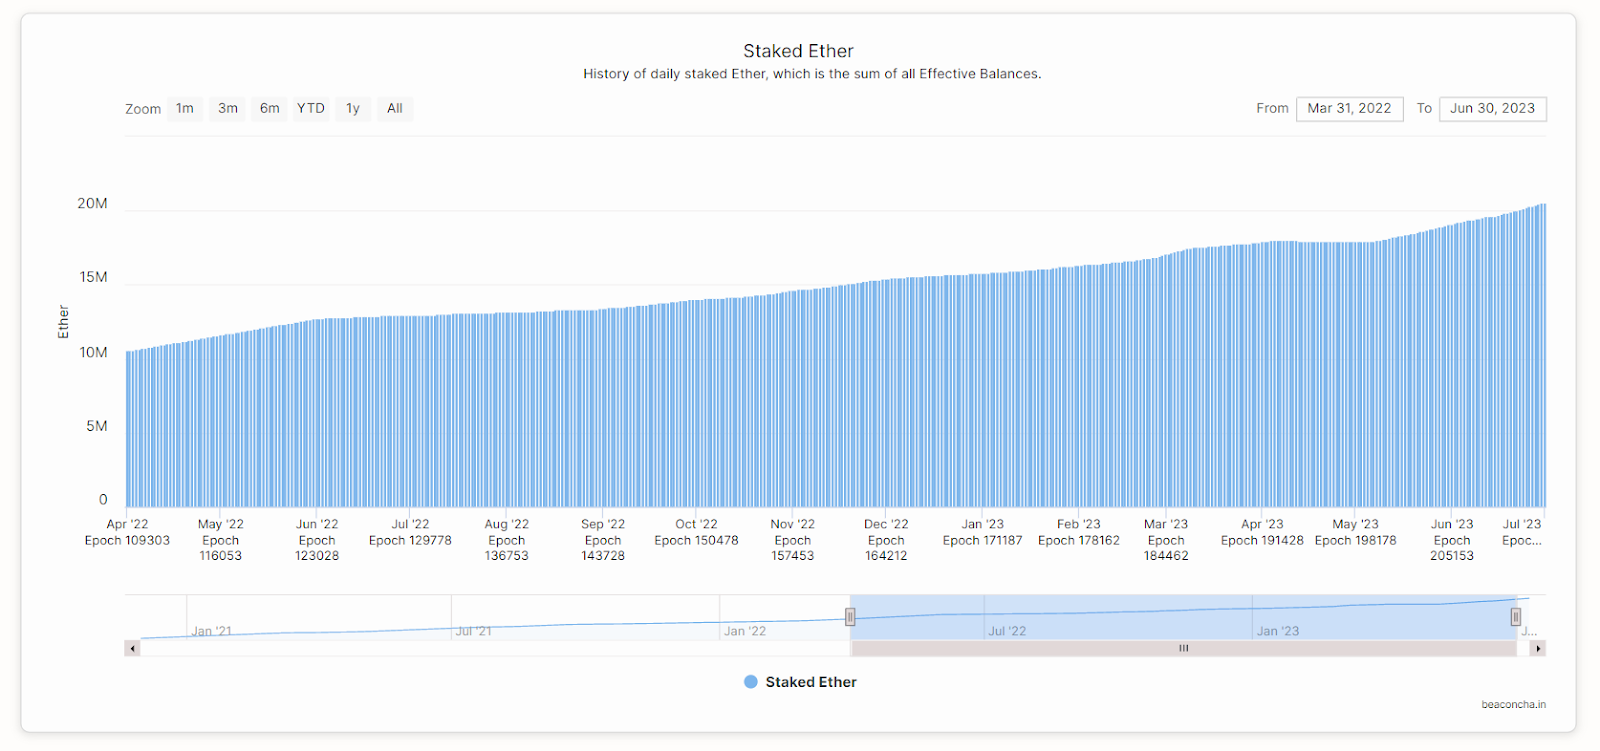
This figure measures the amount of ETH staked on the Beacon Chain to help secure Ethereum’s Proof Of Stake (PoS) consensus system. Roughly 17% of the total supply of ETH was staked by the end of this Q2.


Go direct to DeFi with the Uniswap mobile wallet. Buy crypto on any available chain with your debit card. Seamlessly swap on Mainnet and L2s. Explore tokens, wallets and NFTs. Safe, simple self-custody from the most trusted team in DeFi.
Action steps
- 👁️ Review the previous State of Ethereum Q2 2022 Report
- 🌠 Catch up on our previous primer 8 NFTs That Will Survive